Understanding correlation
325
More important than calculating r (a task for technology) is understanding how correlation measures association. Here are the facts:
• Positive r indicates positive association between the variables, and negative r indicates negative association. The scatterplot in Figure 14.5 shows strong positive association between femur length and humerus length. In three fossils, both bones are longer than their average values, so their standard scores are positive for both x and y. In the other two fossils, the bones are shorter than their averages, so both standard scores are negative. The products are all positive, giving a positive r.
• The correlation r always falls between −1 and 1. Values of r near 0 indicate a very weak straight-line relationship. The strength of the relationship increases as r moves away from 0 toward either −1 or 1. Values of r close to −1 or 1 indicate that the points lie close to a straight line. The extreme values r = −1 and r = 1 occur only when the points in a scatterplot lie exactly along a straight line.
The result r = 0.994 in Example 4 reflects the strong positive straight-line pattern in Figure 14.5. The scatterplots in Figure 14.7 illustrate how r measures both the direction and the strength of a straight-line relationship. Study them carefully. Note that the sign of r matches the direction of the slope in each plot, and that r approaches −1 or 1 as the pattern of the plot comes closer to a straight line.
• Because r uses the standard scores for the observations, the correlation does not change when we change the units of measurement of x, y, or both. Measuring length in inches rather than centimeters in Example 4 would not change the correlation r = 0.994.
Our descriptive measures for one variable all share the same units as the original observations. If we measure length in centimeters, the median, quartiles, mean, and standard deviation are all in centimeters. The correlation between two variables, however, has no unit of measurement; it is just a number between −1 and 1.
• Correlation ignores the distinction between explanatory and response variables. If we reverse our choice of which variable to call x and which to call y, the correlation does not change.
• Correlation measures the strength of only straight-line association between two variables. Correlation does not describe curved relationships between variables, no matter how strong they are.
326
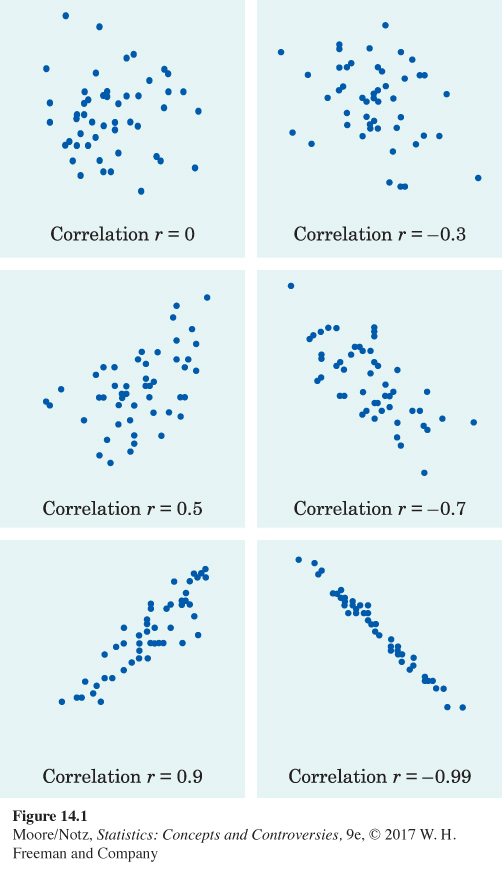 Figure 14.7: Figure 14.7 How correlation measures the strength of a straight-line relationship. Patterns closer to a straight line have correlations closer to 1 or –1.
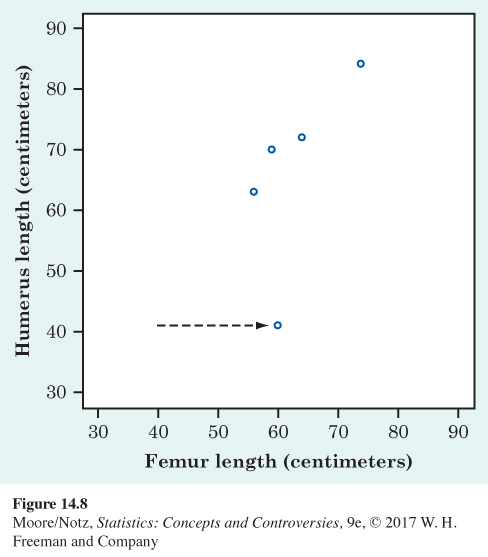
• Like the mean and standard deviation, the correlation is strongly affected by a few outlying observations. Use r with caution when outliers appear in the scatterplot. Look, for example, at Figure 14.8. We changed the femur length of the first fossil from 38 to 60 centimeters. Rather than falling in line with the other fossils, the first is now an outlier. The correlation drops from r = 0.994 for the original data to r = 0.640.
327
NOW IT’S YOUR TURN
ex14-03
Question 14.3
14.3 Brain size and intelligence. For centuries, people have associated intelligence with brain size. A recent study used magnetic resonance imaging to measure the brain size of several individuals. The IQ and brain size (in units of 10,000 pixels) of six individuals are as follows:
| Brain size: | 100 | 90 | 95 | 92 | 88 | 106 |
| IQ: | 140 | 90 | 100 | 135 | 80 | 103 |
Make a scatterplot of these data if you have not already done so. Compare your plot with those in Figure 14.7. What would you estimate the correlation r to be?
There are many kinds of relationships between variables and many ways to measure them. Although correlation is very common, remember its limitations. Correlation makes sense only for quantitative variables—we can speak of the relationship between the sex of voters and the political party they prefer, but not of the correlation between these variables. Even for quantitative variables such as the length of bones, correlation measures only straight-line association.
328
Remember also that correlation is not a complete description of two-variable data, even when there is a straight-line relationship between the variables. You should give the means and standard deviations of both x and y along with the correlation. Because the formula for correlation uses the means and standard deviations, these measures are the proper choice to accompany a correlation.