The idea of probability
Chance is a slippery subject. We start by thinking about “what would happen if we did this many times.” We will also start with examples like the 1-in-2 chance of a head in tossing a coin before we try to think about more complicated situations.
Even the rules of football agree that tossing a coin avoids favoritism. Favoritism in choosing subjects for a sample survey or allotting patients to treatment and placebo groups in a medical experiment is as undesirable as it is in awarding first possession of the ball in football. That’s why statisticians recommend random samples and randomized experiments, which are fancy versions of tossing a coin. A big fact emerges when we watch coin tosses or the results of random samples closely: chance behavior is unpredictable in the short run but has a regular and predictable pattern in the long run.
406
Toss a coin or choose a simple random sample. The result can’t be predicted in advance because the result will vary when you toss the coin or choose the sample repeatedly. But there is still a regular pattern in the results, a pattern that emerges clearly only after many repetitions. This remarkable fact is the basis for the idea of probability.
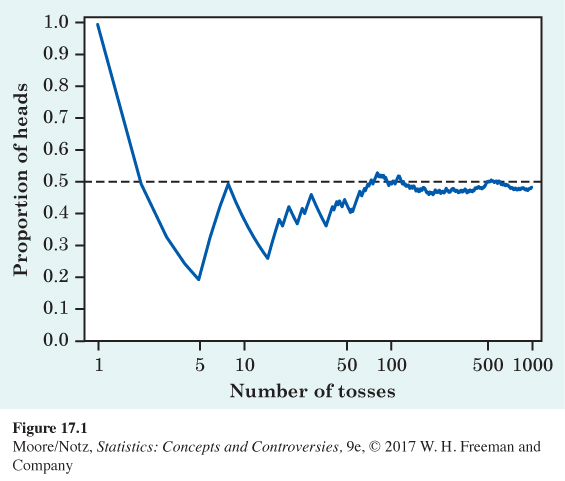
EXAMPLE 1 Coin tossing
When you toss a coin, there are only two possible outcomes, heads or tails. Figure 17.1 shows the results of tossing a coin 1000 times. For each number of tosses from 1 to 1000, we have plotted the proportion of those tosses that gave a head. The first toss was a head, so the proportion of heads starts at 1. The second toss was a tail, reducing the proportion of heads to 0.5 after two tosses. The next four tosses were tails followed by a head, so the proportion of heads after seven tosses is 27, or 0.286.
The proportion of tosses that produce heads is quite variable at first, but it settles down as we make more and more tosses. Eventually, this proportion gets close to 0.5 and stays there. We say that 0.5 is the probability of a head. The probability 0.5 appears as a horizontal line on the graph.
“Random” in statistics is a description of events that are unpredictable in the short run but that exhibit a kind of order that emerges only in the long run. It is not a synonym for “haphazard,” which is defined as lacking any principle of organization. We encounter the unpredictable side of randomness in our everyday experience, but we rarely see enough repetitions of the same random phenomenon to observe the long-term regularity that probability describes. You can see that regularity emerging in Figure 17.1. In the very long run, the proportion of tosses that give a head is 0.5. This is the intuitive idea of probability. Probability 0.5 means “occurs half the time in a very large number of trials.”
407
We might suspect that a coin has probability 0.5 of coming up heads just because the coin has two sides. We might be tempted to theorize that for events with two seemingly equally likely outcomes, each outcome should have probability 0.5 of occurring. But babies must have one of the two sexes, and the probabilities aren’t equal—the probability of a boy is about 0.51, not 0.50. The idea of probability is empirical. That is, it is based on data rather than theorizing alone. Probability describes what happens in very many trials, and we must actually observe many coin tosses or many babies to pin down a probability. In the case of tossing a coin, some diligent people have in fact made thousands of tosses.
EXAMPLE 2 Some coin tossers
The French naturalist Count Buffon (1707 –1788) tossed a coin 4040 times. Result: 2048 heads, or proportion 20484040 = 0.5069 for heads.
Around 1900, the English statistician Karl Pearson heroically tossed a coin 24,000 times. Result: 12,012 heads, a proportion of 0.5005.
While imprisoned by the Germans during World War II, the South African mathematician John Kerrich tossed a coin 10,000 times. Result: 5067 heads, a proportion of 0.5067.
Randomness and probability
We call a phenomenon random if individual outcomes are uncertain but there is, nonetheless, a regular distribution of outcomes in a large number of repetitions.
The probability of any outcome of a random phenomenon is a number between 0 and 1 that describes the proportion of times the outcome would occur in a very long series of repetitions.
An outcome with probability 0 never occurs. An outcome with probability 1 happens on every repetition. An outcome with probability one-half, or 1-in-2, happens half the time in a very long series of trials. Of course, we can never observe a probability exactly. We could always continue tossing the coin, for example. Mathematical probability is an idealization based on imagining what would happen in an infinitely long series of trials.
408
![]() Does God play dice? Few things in the world are truly random in the sense that no amount of information will allow us to predict the outcome. We could, in principle, apply the laws of physics to a tossed coin, for example, and calculate whether it will land heads or tails. But randomness does rule events inside individual atoms. Albert Einstein didn’t like this feature of the new quantum theory. “God does not play dice with the universe,” said the great scientist. Many years later, it appears that Einstein was wrong.
Does God play dice? Few things in the world are truly random in the sense that no amount of information will allow us to predict the outcome. We could, in principle, apply the laws of physics to a tossed coin, for example, and calculate whether it will land heads or tails. But randomness does rule events inside individual atoms. Albert Einstein didn’t like this feature of the new quantum theory. “God does not play dice with the universe,” said the great scientist. Many years later, it appears that Einstein was wrong.
We aren’t thinking deeply here. That some things are random is simply an observed fact about the world. Probability just gives us a language to describe the long-term regularity of random behavior. The outcome of a coin toss, the time between emissions of particles by a radioactive source, and the sexes of the next litter of lab rats are all random. So is the outcome of a random sample or a randomized experiment. The behavior of large groups of individuals is often as random as the behavior of many coin tosses or many random samples. Life insurance, for example, is based on the fact that deaths occur at random among many individuals.
EXAMPLE 3 The probability of dying
We can’t predict whether a particular person will die in the next year. But if we observe millions of people, deaths are random. In 2013, the National Center for Health Statistics reported that the proportion of men aged 20 to 24 years who die in any one year is 0.0012. This is the probability that a young man will die next year. For women that age, the probability of death is about 0.0004.
If an insurance company sells many policies to people aged 20 to 24, it knows that it will have to pay off next year on about 0.12% of the policies sold on men’s lives and on about 0.04% of the policies sold on women’s lives. It will charge more to insure a man because the probability of having to pay is higher.