More elaborate simulations
The building and simulation of random models constitute a powerful tool of contemporary science, but a tool that can be understood without advanced mathematics. What is more, doing a few simulations will increase your understanding of probability more than many pages of our prose. Having in mind these two goals of understanding simulation for itself and understanding simulation to understand probability, let us look at two more elaborate examples. The first still has independent trials, but there is no longer a fixed number of trials as there was when we tossed a coin 10 times.
EXAMPLE 4 We want a girl
A couple plan to have children until they have a girl or until they have three children, whichever comes first. What is the probability that they will have a girl among their children?
Step 1. The probability model is like that for coin tossing:
• Each child has probability 0.49 of being a girl and 0.51 of being a boy. (Yes, more boys than girls are born. Boys have higher infant mortality, so the sexes even out soon.)
• The sexes of successive children are independent.
Step 2. Assigning digits is also easy. Two digits simulate the sex of one child. We assign 49 of the 100 pairs to “girl” and the remaining 51 to “boy”:
00, 01, 02, . . . , 48 = girl
49, 50, 51, . . . , 99 = boy
453
Step 3. To simulate one repetition of this childbearing strategy, read pairs of digits from Table A until the couple have either a girl or three children. The number of pairs needed to simulate one repetition depends on how quickly the couple get a girl. Here are 10 repetitions, simulated using line 130 of Table A. To interpret the pairs of digits, we have written G for girl and B for boy under them, have added space to separate repetitions, and under each repetition have written “+” if a girl was born and “−” if not.
| 6905 | 16 | 48 | 17 | 8717 | 40 | 9517 | 845340 | 648987 | 20 |
| B G | G | G | G | B G | G | B G | B B G | B B B | G |
| + | + | + | + | + | + | + | + | − | + |
In these 10 repetitions, a girl was born nine times. Our estimate of the probability that this strategy will produce a girl is, therefore,
estimated probability
Some mathematics shows that, if our probability model is correct, the true probability of having a girl is 0.867. Our simulated answer came quite close. Unless the couple are unlucky, they will succeed in having a girl.
Our final example has stages that are not independent. That is, the probabilities at one stage depend on the outcome of the preceding stage.
EXAMPLE 5 A kidney transplant
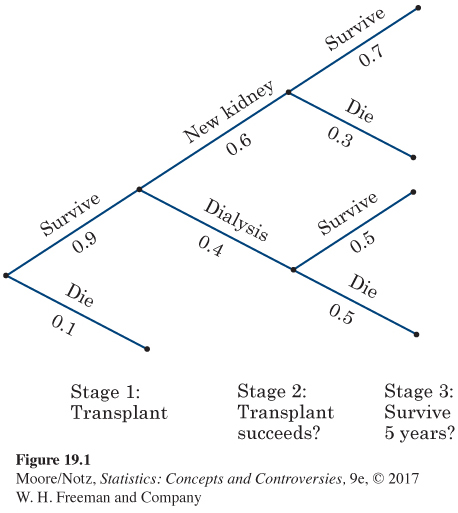
Morris’s kidneys have failed and he is awaiting a kidney transplant. His doctor gives him this information for patients in his condition: 90% survive the transplant operation, and 10% die. The transplant succeeds in 60% of those who survive, and the other 40% must return to kidney dialysis. The proportions who survive for at least five years are 70% for those with a new kidney and 50% for those who return to dialysis. Morris wants to know the probability that he will survive for at least five years.
Step 1. The tree diagram in Figure 19.1 organizes this information to give a probability model in graphical form. The tree shows the three stages and the possible outcomes and probabilities at each stage. Each path through the tree leads to either survival for five years or to death in less than five years. To simulate Morris’s fate, we must simulate each of the three stages. The probabilities at Stage 3 depend on the outcome of Stage 2.
454
Step 2. Here is our assignment of digits to outcomes:
Stage 1:
0 = die
1, 2, 3, 4, 5, 6, 7, 8, 9 = survive
Stage 2:
0, 1, 2, 3, 4, 5 = transplant succeeds
6, 7, 8, 9 = return to dialysis
Stage 3 with kidney:
0, 1, 2, 3, 4, 5, 6 = survive five years
7, 8, 9 = die
Stage 3 with dialysis:
0, 1, 2, 3, 4 = survive five years
5, 6, 7, 8, 9 = die
The assignment of digits at Stage 3 depends on the outcome of Stage 2. That’s lack of independence.
455
Step 3. Here are simulations of several repetitions, each arranged vertically. We used random digits from line 110 of Table A.
| Repetition 1 | Repetition 2 | Repetition 3 | Repetition 4 | |
| Stage 1 | 3 Survive | 4 Survive | 8 Survive | 9 Survive |
| Stage 2 | 8 Dialysis | 8 Dialysis | 7 Dialysis | 1 Kidney |
| Stage 3 | 4 Survive | 4 Survive | 8 Die | 8 Die |
Morris survives five years in two of our four repetitions. Now that we understand how to arrange the simulation, we should turn it over to a computer to do many repetitions. From a long simulation or from mathematics, we find that Morris has probability 0.558 of living for at least five years.
NOW IT’S YOUR TURN
Question 19.2
19.2 Selecting cards at random. In a standard deck of 52 cards, there are 13 spades, 13 hearts, 13 diamonds, and 13 clubs. Carry out a simulation to determine the probability that, when two cards are selected together (that is, without replacement) at random from a standard deck, both have the same suit. Follow the steps given in Example 5 to help set up the simulation. Do your simulation 10 times and use the result to estimate the probability.