CHAPTER 8 EXERCISES
Question 8.8
8.8 Counting the unemployed? We could measure the extent of unemployment by a count (the number of people who are unemployed) or by a rate (the percentage of the labor force that is unemployed). The number of people in the labor force grew from 115 million in June 1985, to 132 million in June 1995, to 149 million in June 2005, to 157 million in June 2015. Use these facts to explain why the count of unemployed people is not a valid measure of the extent of unemployment.
Question 8.9
8.9 Measuring a healthy lifestyle. You want to measure the “healthiness” of college students’ lifestyles. Give an example of a clearly invalid way to measure healthiness. Then briefly describe a measurement process that you think is valid.
Question 8.10
8.10 Rates versus counts. Customers returned 40 cell phones to Verizon this spring, and only 15 to Best Buy next door. Verizon sold 800 cell phones this spring, while Best Buy sold 200.
(a) Verizon had a greater number of cell phones returned. Why does this not show that Verizon’s cell phone customers were less satisfied than those of Best Buy?
(b) What is the rate of returns (percentage of cell phones returned) at each of the stores?
(c) Use the rates of returns that you calculated to explain to a friend which store you would suggest your friend go to to purchase a cell phone.
Question 8.11
8.11 Seat belt safety. The National Highway Traffic Safety Administration reports that in 2013, 9777 occupants of motor vehicles who were wearing a restraint died in motor vehicle accidents and 9580 who were not wearing a restraint died. These numbers suggest that not using a restraining device is safer than using one. The counts aren’t fully convincing, however. What rates would you like to know to compare the safety of using a restraint with not using one?
Question 8.12
8.12 Tough course? A friend tells you, “In the 7:30 A.M. lecture for Statistics 101, 9 students failed, but 20 students failed in the 1:30 P.M. lecture. The 1:30 P.M. prof is a tougher grader than the 7:30 A.M. prof.” Explain why the conclusion may not be true. What additional information would you need to compare the classes?
182
Question 8.13
%20In%20the%20NEWS%20cyan.jpg) 8.13 Obesity. An article in the June 30, 2010, Columbus Dispatch reported on the prevalence of obesity among adults in the 50 states. Based on information in the article, California has approximately 6.7 million obese adults, and Texas has approximately 5.2 million. On the other hand, Mississippi has a little over 730,000 obese adults. Do these numbers make a convincing case that California and Texas have a more substantial problem with obesity than Mississippi?
8.13 Obesity. An article in the June 30, 2010, Columbus Dispatch reported on the prevalence of obesity among adults in the 50 states. Based on information in the article, California has approximately 6.7 million obese adults, and Texas has approximately 5.2 million. On the other hand, Mississippi has a little over 730,000 obese adults. Do these numbers make a convincing case that California and Texas have a more substantial problem with obesity than Mississippi?
Question 8.14
8.14 Capital punishment. Between 1977 and 2014, 1394 convicted criminals were put to death in the United States. Here are data on the number of executions in several states during those years, as well as the estimated June 1, 2014, population of these states:
| State | Population (thousands) |
Executions |
|---|---|---|
| Alabama | 4,849 | 56 |
| Arkansas | 2,966 | 27 |
| Delaware | 936 | 16 |
| Florida | 19,893 | 89 |
| Indiana | 6,597 | 20 |
| Nevada | 2,839 | 12 |
| Oklahoma | 3,878 | 111 |
| Texas | 26,957 | 518 |
Texas and Florida are among the leaders in executions. Because these are large states, we might expect them to have many executions. Find the rate of executions for each of the states just listed, in executions per million population. Because population is given in thousands, you can find the rate per million as
Arrange the states in order of the number of executions relative to population. Are Texas and Florida still high by this measure? Does any other state stand out when you examine the rates?
Question 8.15
8.15 Measuring intelligence. One way “intelligence” can be interpreted is as “general problem-solving ability.” Explain why it is not valid to measure intelligence by a test that asks questions such as
Who wrote “The Star-Spangled Banner”?
Who won the last soccer World Cup?
Question 8.16
8.16 Measuring life’s quality. Is life in Britain getting better or worse? The usual government data do not measure “better” or “worse” directly. So the British government announced that it wanted to add measures of such things as housing, traffic, and air pollution. “The quality of life is not simply economic,” said a deputy prime minister. Help them out: how would you measure “traffic” and its impact on the quality of life?
Question 8.17
8.17 Measuring pain. There are 9 million enrollees in the Department of Veterans Affairs health care system. It wants doctors and nurses to treat pain as a “fifth vital sign” to be recorded along with blood pressure, pulse, temperature, and breathing rate. Help out the VA: how would you measure a patient’s pain? [Note: There is not one correct answer for this question.]
183
Question 8.18
8.18 Fighting cancer. Congress wants the medical establishment to show that progress is being made in fighting cancer. Here are some variables that might be used:
1. Total deaths from cancer. These have risen sharply over time, from 331,000 in 1970, to 505,000 in 1990, to 572,000 in 2011.
2. The percentage of all Americans who die from cancer. The percentage of deaths due to cancer rose steadily, from 17.2% in 1970 to 23.5% in 1990, then leveled off around 23.2% in 2007.
3. The percentage of cancer patients who survive for five years from the time the disease is discovered. These rates are rising slowly. The five-year survival rate was 50% in the 1975 to 1977 period and 66.5% from 2005 to 2011.
None of these variables is fully valid as a measure of the effectiveness of cancer treatment. Explain why Variables 1 and 2 could increase even if treatment is getting more effective and why Variable 3 could increase even if treatment is getting less effective.
Question 8.19
8.19 Testing job applicants. The law requires that tests given to job applicants must be shown to be directly job related. The Department of Labor believes that an employment test called the General Aptitude Test Battery (GATB) is valid for a broad range of jobs. As in the case of the SAT, blacks and Hispanics get lower average scores on the GATB than do whites. Describe briefly what must be done to establish that the GATB has predictive validity as a measure of future performance on the job.
Question 8.20
8.20 Validity, bias, reliability. This winter I went to a local pharmacy to have my weight and blood pressure measured using a sophisticated electronic machine at the front of the store next to the checkout counter. Will the measurement of my weight be biased? Reliable? Valid? Explain your answer.
Question 8.21
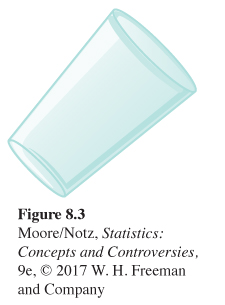
8.21 An activity on bias. Let’s study bias in an intuitive measurement. Figure 8.3 is a drawing of a tilted glass. Reproduce this drawing on 10 sheets of paper. Choose 10 people: five men and five women. Explain that the drawing represents a tilted glass of water. Ask each subject to draw the water level when this tilted glass is holding as much water as it can.
The correct level is horizontal (straight back from the lower lip of the glass). Many people make large errors in estimating the level. Use a protractor to measure the angle of each subject’s error. Were your subjects systematically wrong in the same direction? How large was the average error? Was there a clear difference between the average errors made by men and by women?
184
Question 8.22
8.22 An activity on bias and reliability. Cut five pieces of string having these lengths in inches:
2.9 9.5 5.7 4.2 7.6
(a) Show the pieces to another student one at a time, asking the subject to estimate the length to the nearest 10th of an inch by eye. The error your subject makes is measured value minus true value and can be either positive or negative. What is the average of the five errors? Explain why this average would be close to 0 if there were no bias and we used many pieces of string rather than just five.
(b) The following day, ask the subject to again estimate the length of each piece of string. (Present them in a different order on the second day.) Explain why the five differences between the first and second guesses would all be 0 if your subject were a perfectly reliable measurer of length. The bigger the differences, the less reliable your subject is. What is the average difference (ignoring whether they are positive or negative) for your subject?
Question 8.23
8.23 More on bias and reliability. The previous exercise gives five true values for lengths. A subject measures each length twice by eye. Make up a set of results from this activity that matches each of the following descriptions. For simplicity, assume that bias means the same fixed error every time rather than an “on the average” error in many measurements.
(a) The subject has a bias of 0.5 inch too long and is perfectly reliable.
(b) The subject has no bias but is not perfectly reliable, so the average difference in repeated measurements is 0.5 inch.
Question 8.24
8.24 Even more on bias and reliability. Exercise 8.22 gives five true values for lengths. A subject measures the first length (true length = 2.9 inches) four times by eye. His measurements are
3.0 2.9 3.1 3.0
Suppose his measurements have a bias of +0.1 inch.
(a) What are the four random errors for his measurements?
(b) What is the variance of his four measurements?
Question 8.25
8.25 Does job training work? To measure the effectiveness of government training programs, it is usual to compare workers’ pay before and after training. But many workers sign up for training when their pay drops or they are laid off. So the “before” pay is unusually low, and the pay gain looks large.
(a) Is this bias or random error in measuring the effect of training on pay? Why?
(b) How would you measure the success of training programs?
Question 8.26
8.26 A recipe for poor reliability. Every month, the government releases data on “personal savings.” This number tells us how many dollars individuals saved the previous month. Savings are calculated by subtracting personal spending (an enormously large number) from personal income (another enormous number). The result is one of the government’s least reliable statistics.
Give a numerical example to show that small percentage changes in two very large numbers can produce a big percentage change in the difference between those numbers. A variable that is the difference between two big numbers is usually not very reliable.
185
Question 8.27
8.27 Measuring crime. Crime data make headlines. We measure the amount of crime by the number of crimes committed or (better) by crime rates (crimes per 100,000 population). The FBI publishes data on crime in the United States by compiling crimes reported to police departments. The FBI data are recorded in the Uniform Crime Reporting Program and are based on reports from more than 18,000 law enforcement agencies across the United States. The National Crime Victimization Survey publishes data about crimes based on a national probability sample of about 90,000 households per year. The victim survey shows almost two times as many crimes as the FBI report. Explain why the FBI report has a large downward bias for many types of crime. (Here is a case in which bias in producing data leads to bias in measurement.)
Question 8.28
8.28 Measuring crime. Twice each year, the National Crime Victimization Survey asks a random sample of households whether they have been victims of crime and, if so, the details. In all, nearly 160,000 people in about 90,000 households answer these questions per year. If other people in a household are in the room while one person is answering questions, the measurement of, for example, rape and other sexual assaults could be seriously biased. Why? Would the presence of other people lead to overreporting or underreporting of sexual assaults?
Question 8.29
8.29 Measuring pulse rate. You want to measure your resting pulse rate. You might count the number of beats in five seconds and multiply by 12 to get beats per minute.
(a) Consider counting the number of beats in 15 seconds and multiplying by 4 to get beats per minute. In what way will this improve the reliability of your measurement?
(b) Why are the first two measurement methods less reliable than actually measuring the number of beats in a minute?
Question 8.30
8.30 Testing job applicants. A company used to give IQ tests to all job applicants. This is now illegal because IQ is not related to the performance of workers in all the company’s jobs. Does the reason for the policy change involve the reliability, the bias, or the validity of IQ tests as a measure of future job performance? Explain your answer.
Question 8.31
8.31 The best earphones. You are writing an article for a consumer magazine based on a survey of the magazine’s readers that asked about satisfaction with mid-priced earphones for the iPad and iPhone. Of 1648 readers who reported owning the Apple in-ear headphone with remote and mic, 347 gave it an outstanding rating. Only 69 outstanding ratings were given by the 134 readers who owned Klipsch Image S4i earphones with microphone. Describe an appropriate variable, which can be computed from these counts, to measure high satisfaction with a make of earphone. Compute the values of this variable for the Apple and Klipsch earphones. Which brand has the better high-satisfaction rating?
186
Question 8.32
8.32 Where to work? Each year, Forbes magazine ranks the 2000 largest metropolitan areas in the United States in an article on the best places for businesses and careers. First place in 2014 went to Raleigh, North Carolina. Raleigh was ranked third in 2013. Second place in 2014 went to Des Moines, Iowa. Des Moines was ranked first in 2013. Anchorage, Alaska, was ranked 53rd in 2014 but was ranked 18th in 2013! Are these facts evidence that Forbes’s ratings are invalid, biased, or unreliable? Explain your choice.
Question 8.33
8.33 Validity, bias, reliability. Give your own example of a measurement process that is valid but has large bias. Then give your own example of a measurement process that is invalid but highly reliable.

EXPLORING THE WEB
Follow the QR code to access exercises.