1.6 CHAPTER 1 EXERCISES
74
Question 1.33
![]() 1.145 Sources of energy consumed. Energy consumed in the United Staters can be classified as coming from one of three sources: fossil fuels, nuclear and electric power, and renewable energy. In 2014, the energy from these three sources was 80.3, 8.3, and 9.6 quadrillion Btu, respectively. In 2004, the corresponding amounts were 85.8, 8.2, and 6.1.37 Write a description of the changes from 2004 to 2014 expressed in these data. Illustrate your summary with appropriate graphical summaries. Be sure to discuss both the amounts of energy from each source as well as the percents.
1.145 Sources of energy consumed. Energy consumed in the United Staters can be classified as coming from one of three sources: fossil fuels, nuclear and electric power, and renewable energy. In 2014, the energy from these three sources was 80.3, 8.3, and 9.6 quadrillion Btu, respectively. In 2004, the corresponding amounts were 85.8, 8.2, and 6.1.37 Write a description of the changes from 2004 to 2014 expressed in these data. Illustrate your summary with appropriate graphical summaries. Be sure to discuss both the amounts of energy from each source as well as the percents.
Question 1.34
1.146 CO2 emissions in vehicles. Natural Resources Canada tests new vehicles each year and reports several variables related to fuel consumption for vehicles in different classes.38 For 2015, it provides data for 527 vehicles that use regular fuel. Two variables reported are carbon dioxide (CO2) emissions and highway fuel consumption. CO2 is measured in grams per kilometer (g/km), and highway fuel consumption measured in liters per 100 kilometers (L/km). Use graphical and numerical summaries to describe the distribution of CO2 emissions for these vehicles. Be sure to justify your choice of summaries. ![]()
| Type | Number |
|---|---|
| Management | 10916 |
| Sales | 5981 |
| Information technology | 4605 |
| Customer service | 4116 |
| Marketing | 3821 |
| Finance | 2339 |
| Health care | 2231 |
| Accounting | 2175 |
| Human resources | 1685 |
75
Question 1.35
1.151 What graph would you use? What type of graph or graphs would you plan to make in a study of each of the following issues?
What makes of cars do students drive? How old are their cars?
How many hours per week do students study? How does the number of study hours change during a semester?
Which radio stations are most popular with students?
When many students measure the concentration of the same solution for a chemistry course laboratory assignment, do their measurements follow a Normal distribution?
76
Question 1.36
![]() 1.157 How much vitamin C do women consume? To evaluate whether or not the intake of a vitamin or mineral is adequate, comparisons are made between the intake distribution and the requirement distribution. Here is some information about the distribution of vitamin C intake, in milligrams per day, for women aged 19 to 30 years:44
1.157 How much vitamin C do women consume? To evaluate whether or not the intake of a vitamin or mineral is adequate, comparisons are made between the intake distribution and the requirement distribution. Here is some information about the distribution of vitamin C intake, in milligrams per day, for women aged 19 to 30 years:44
| Percentile (mg/d) | Mean | 1st | 5th | 19th | 25th | 50th | 75th | 90th | 95th | 99th | |||||||||
|---|---|---|---|---|---|---|---|---|---|---|---|---|---|---|---|---|---|---|---|
| 84.1 | 31 | 42 | 48 | 61 | 79 | 102 | 126 | 142 | 179 | ||||||||||
Use the 5th, the 50th, and the 95th percentiles of this distribution to estimate the mean and standard deviation of this distribution assuming that the distribution is Normal. Explain your method for doing this.
Sketch your Normal intake distribution on the same graph with a sketch of the requirement distribution that you produced in part (b) of Exercise 1.155.
Do you think that many women aged 19 to 30 years are getting the amount of vitamin C that they need? Explain your answer.
77
Question 1.37
1.162 Spam filters. A university department installed a spam filter on its computer system. During a 21-day period, 6693 messages were tagged as spam. How much spam you get depends on what your online habits are. Here are the counts for some students and faculty in this department (with log-in IDs changed, of course):
| ID | Count | ID | Count | ID | Count | ID | Count |
|---|---|---|---|---|---|---|---|
| AA | 1818 | BB | 1358 | CC | 442 | DD | 416 |
| EE | 399 | FF | 389 | GG | 304 | HH | 251 |
| II | 251 | JJ | 178 | KK | 158 | LL | 103 |
Question 1.38
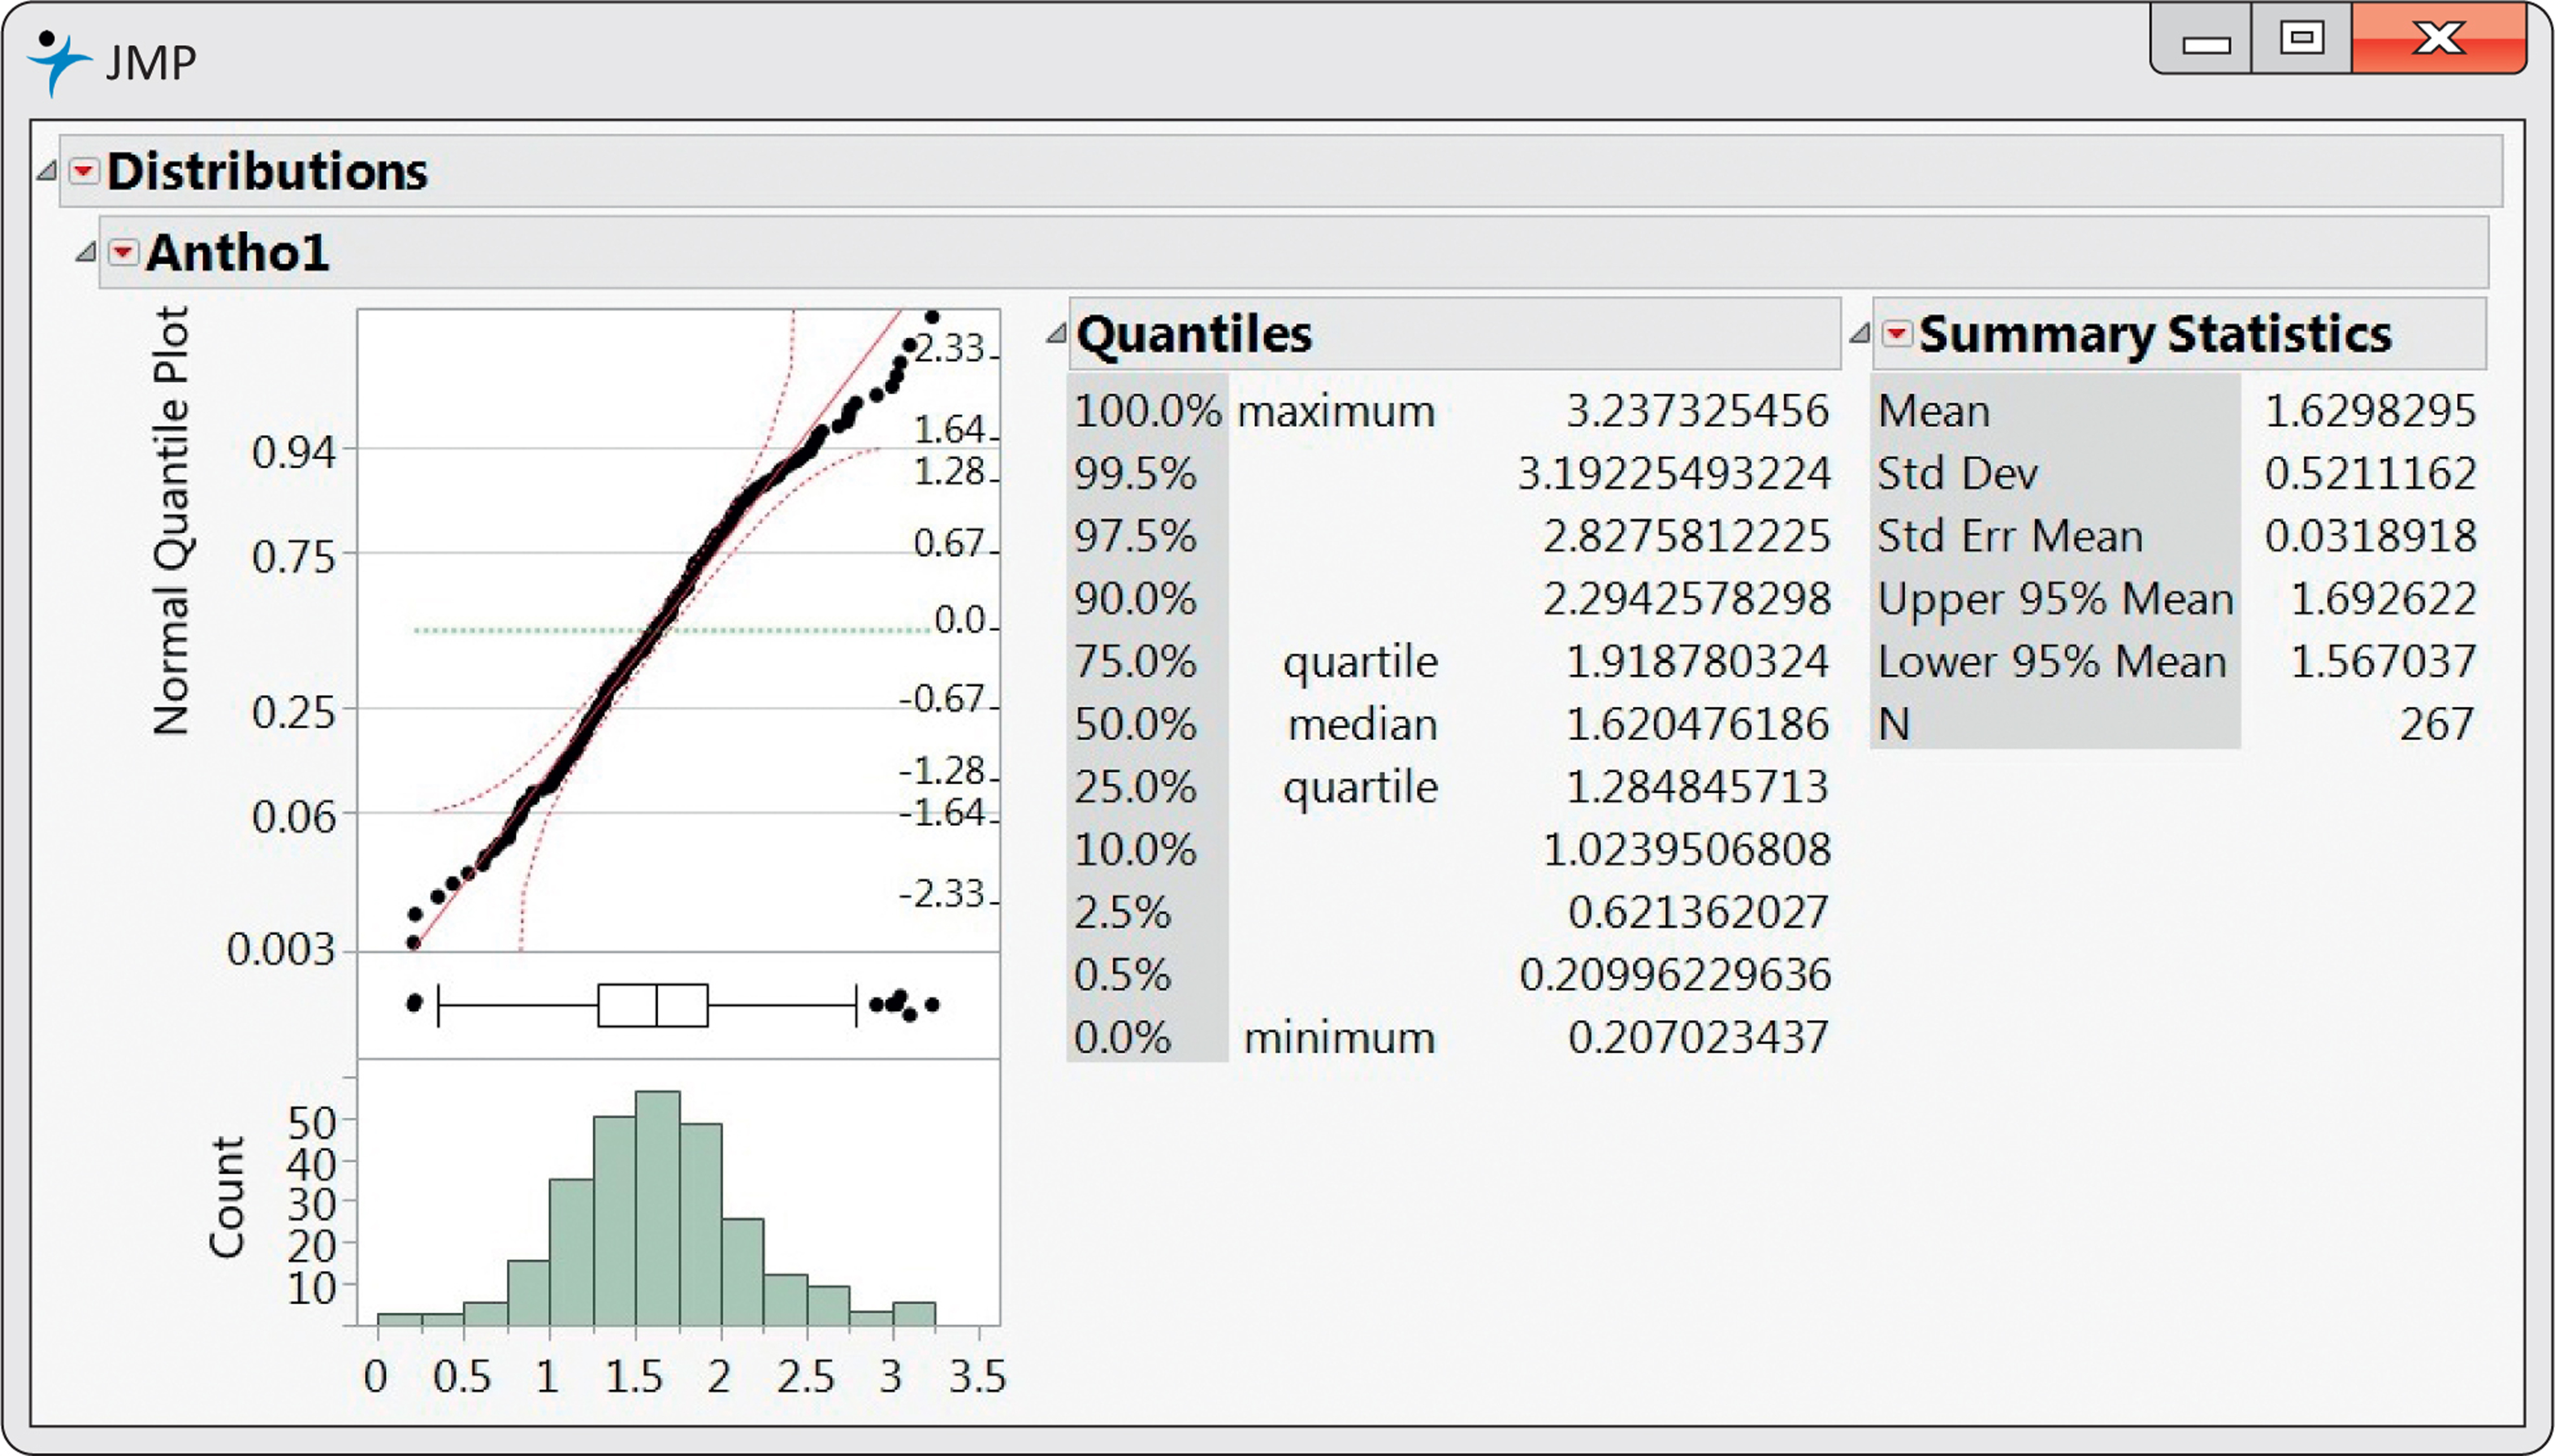
![]() 1.166 Blueberries and anthocyanins, Antho2. Refer to the previous exercise. Generate your own output for the analysis of Antho2 and use your output to write a summary of the distribution of Antho2 using the methods and ideas that you learned in this chapter.
1.166 Blueberries and anthocyanins, Antho2. Refer to the previous exercise. Generate your own output for the analysis of Antho2 and use your output to write a summary of the distribution of Antho2 using the methods and ideas that you learned in this chapter. ![]()
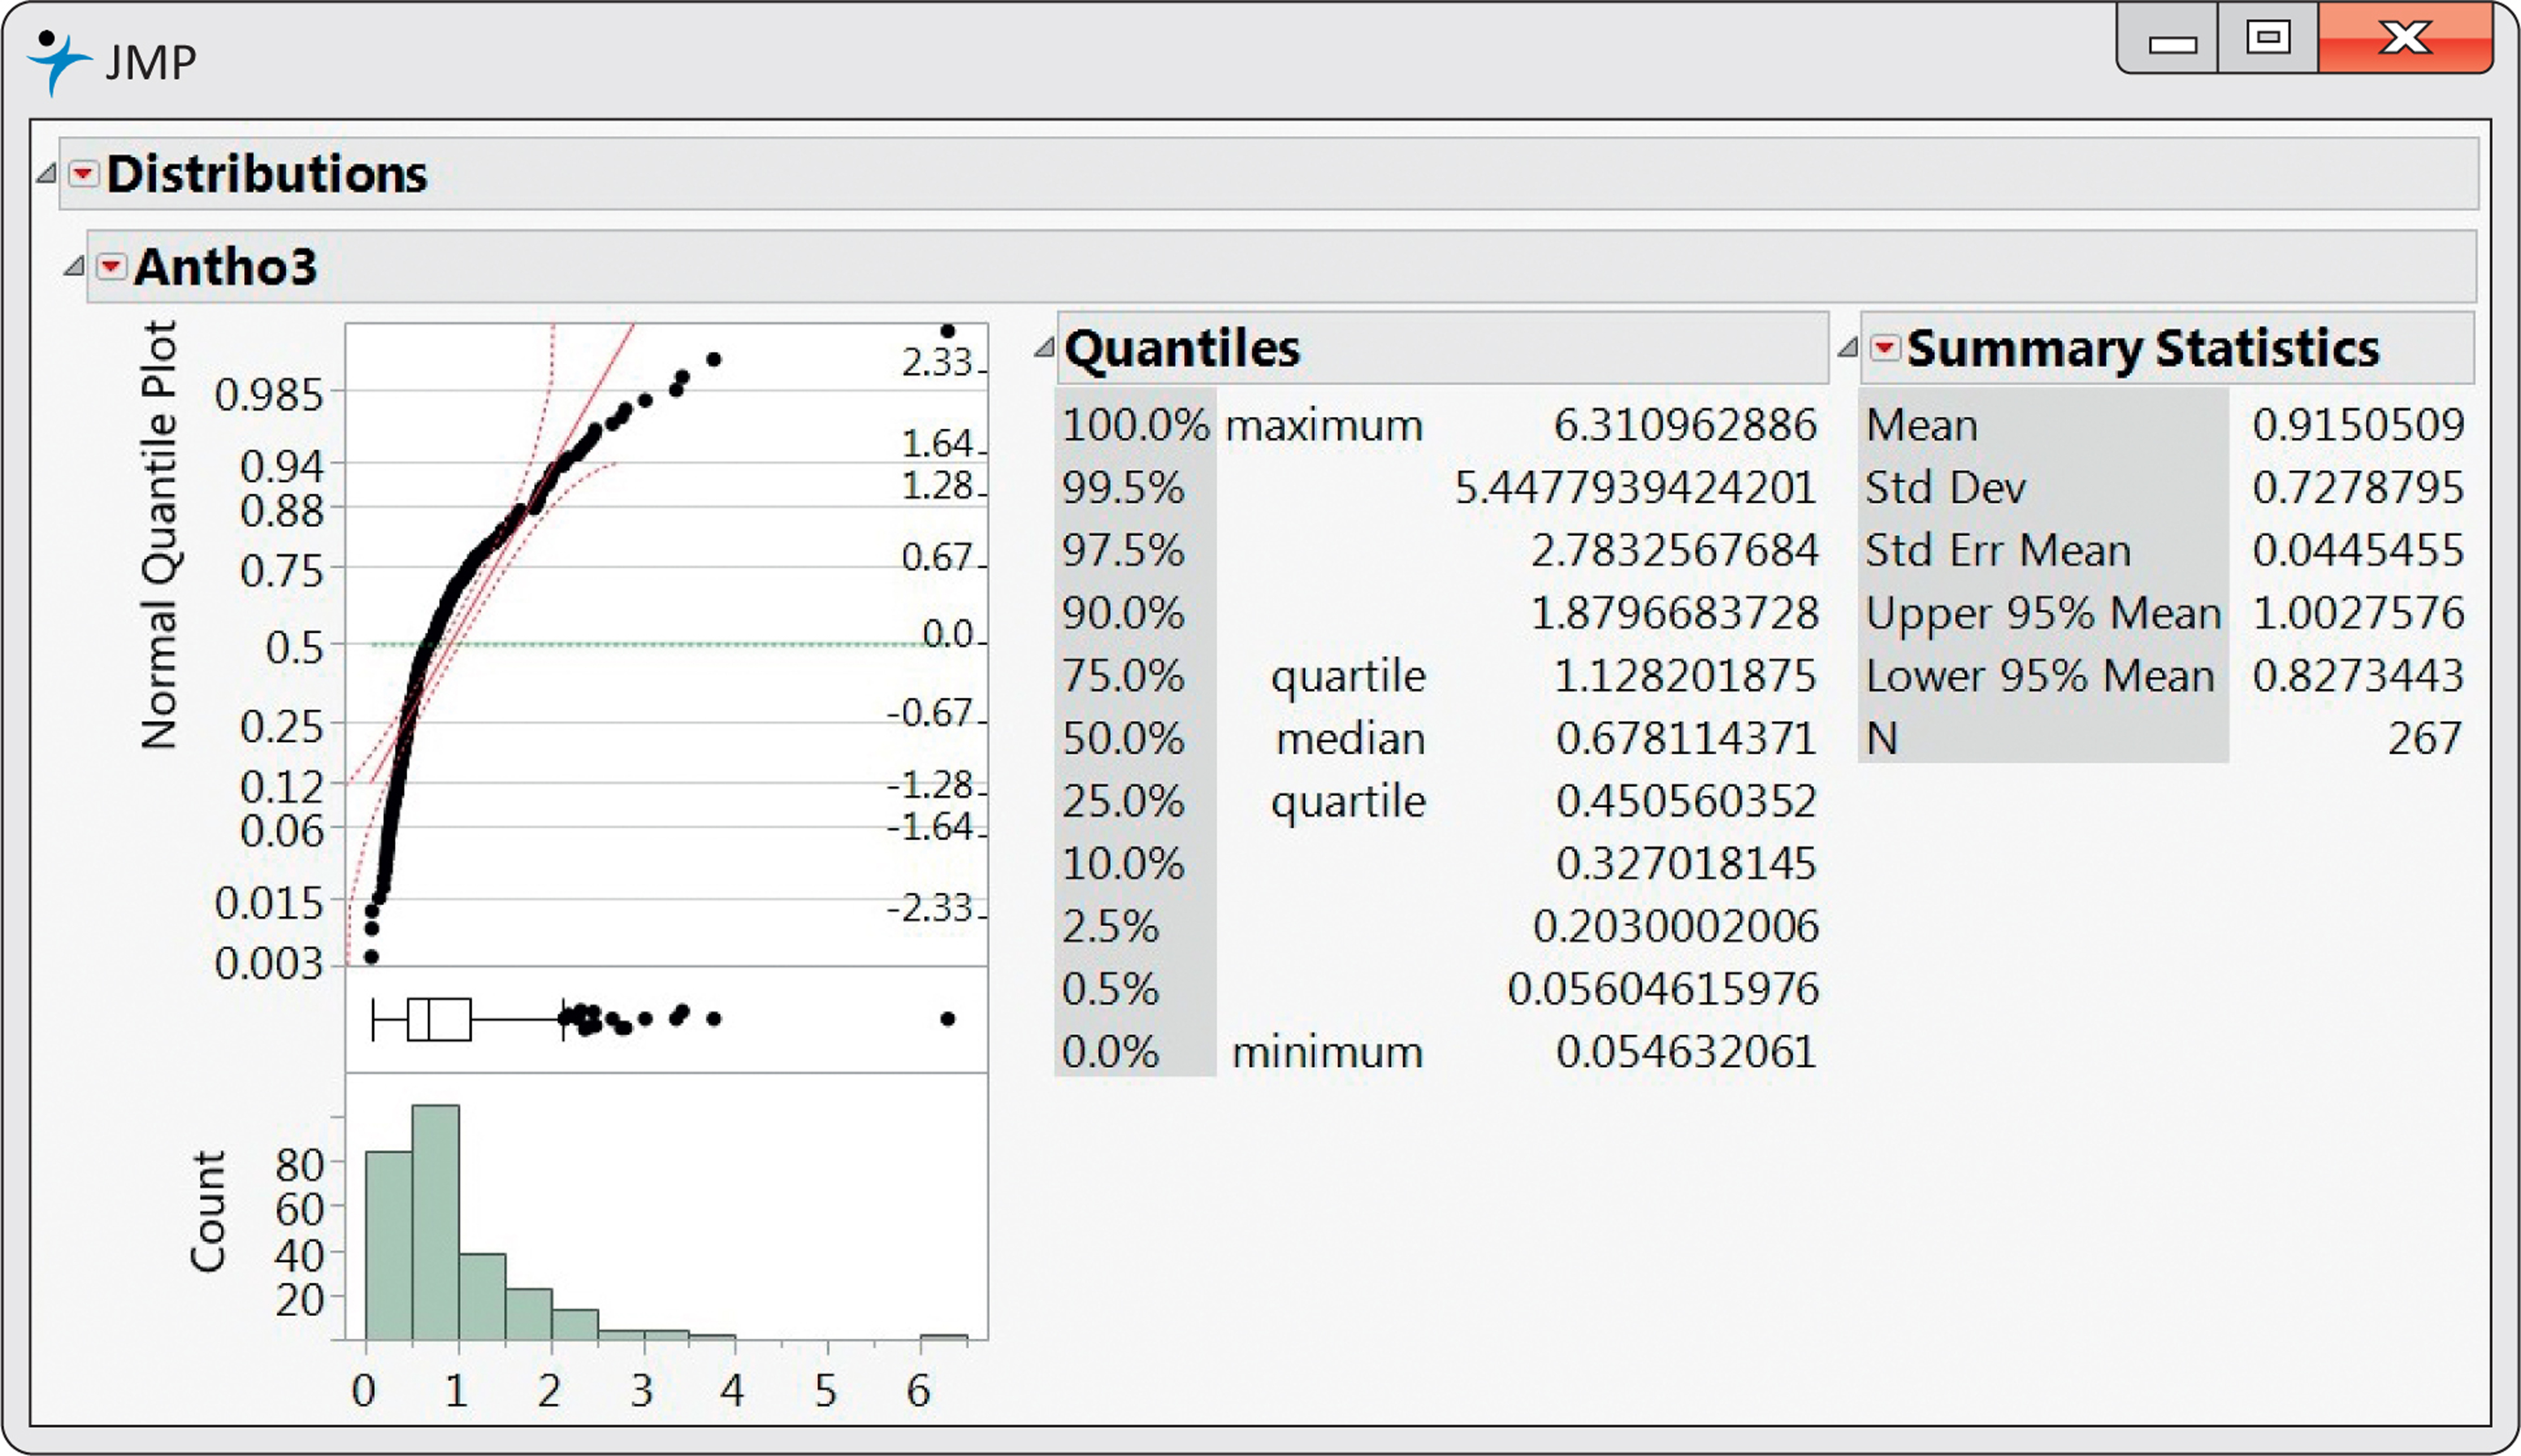
1.167 Blueberries and anthocyanins, Antho3. Refer to Exercise 1.165. Figure 1.36 gives the JMP output for Antho3. Use this output to write a summary of the distribution of Antho3 using the methods and ideas that you learned in this chapter. ![]()
1.168 Blueberries and anthocyanins, Antho4. Refer to Exercise 1.165. Generate your own output for the analysis of Antho4 and use your output to write a summary of the distribution of Antho4 using the methods and ideas that you learned in this chapter. ![]()
78