1.2 1.1 Data
2
When you complete this section, you will be able to:
Give examples of cases in a data set.
Identify the variables in a data set.
Demonstrate how a label can be used as a variable in a data set.
Identify the values of a variable.
Classify variables as categorical or quantitative.
Describe the key characteristics of a set of data.
Explain how a rate is the result of adjusting one variable to create another.
A statistical analysis starts with a set of data. We construct a set of data by first deciding what cases, or units, we want to study. For each case, we record information about characteristics that we call variables.
CASES, LABELS, VARIABLES, AND VALUES
are the objects described by a set of data. Cases may be customers, companies, subjects in a study, units in an experiment, or other objects.
A is a special variable used in some data sets to distinguish the different cases.
A is a characteristic of a case.
Different cases can have different of the variables.
EXAMPLE 1.1
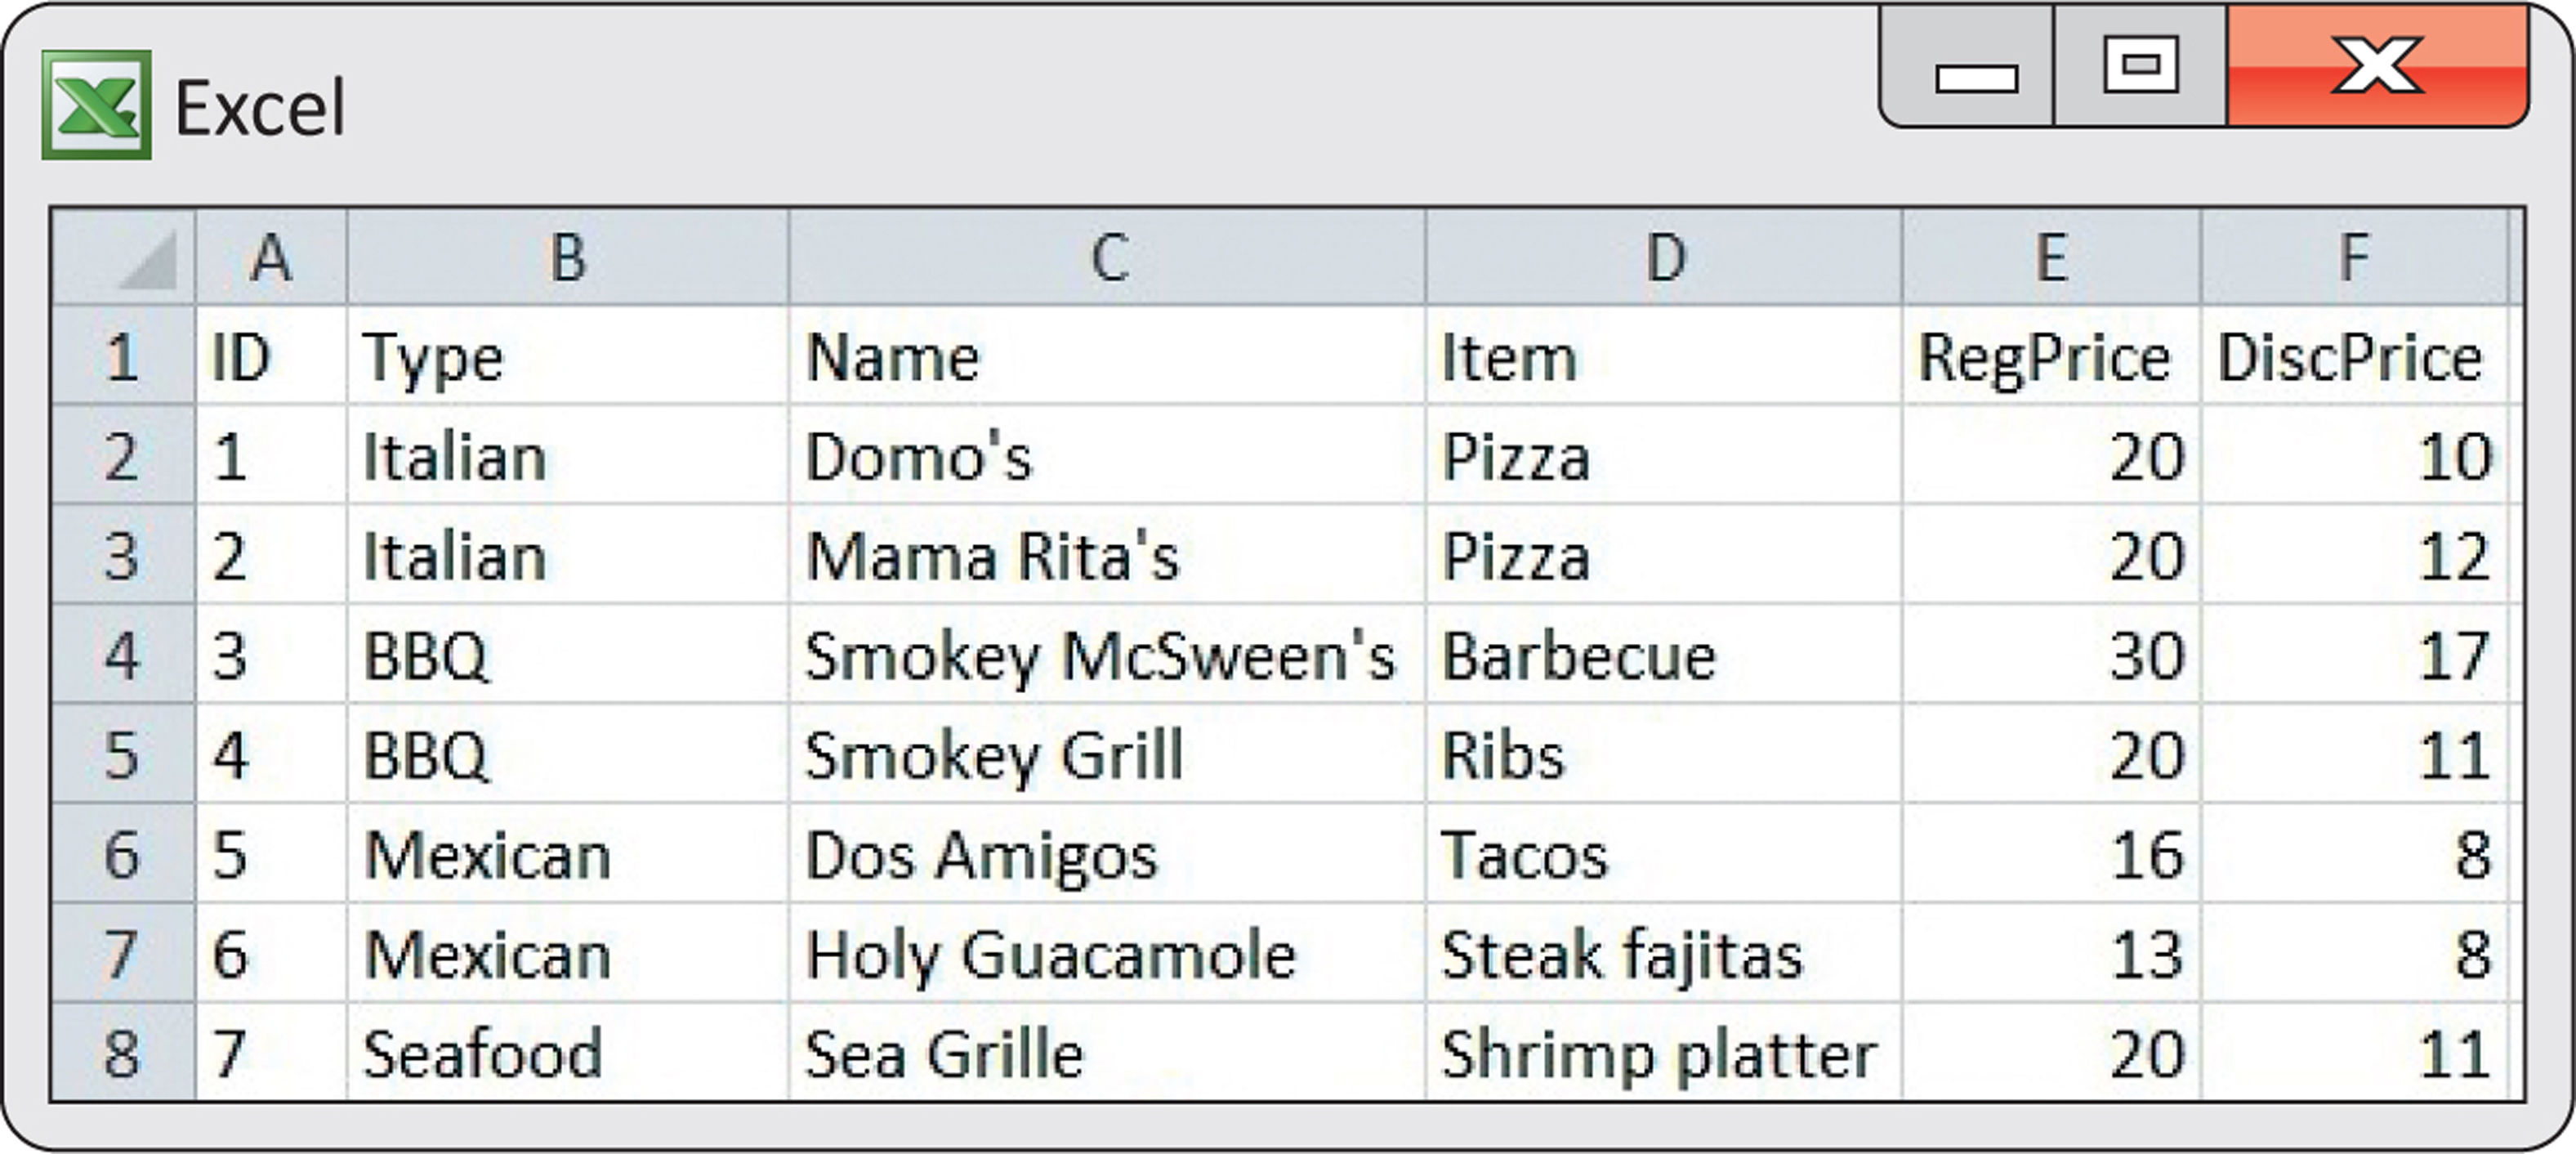
Restaurant discount coupons. A website offers coupons that can be used to get discounts for various items at local restaurants. Coupons for food are very popular. Figure 1.1 gives information for seven restaurant coupons that were available for a recent weekend. These are the cases. Data for each coupon are listed on a different line, and the first column has the coupons numbered from 1 to 7. The remaining columns gives the type of restaurant, the name of the restaurant, the item being discounted, the regular price, and the discount price.
![]()
3
Some variables, like the type of restaurant, the name of the restaurant, and the item simply place coupons into categories. The regular price and discount price columns have numerical values for which we can do arithmetic. It makes sense to give an average of the regular prices, but it does not make sense to give an “average” type of restaurant. We can, however, do arithmetic to compare the regular prices classified by type of restaurant.
EXAMPLE 1.2
Categorical and quantitative variables for coupons. The restaurant discount coupon file has six variables: coupon number, type of restaurant, name of restaurant, item, regular price, and discount price. The two price variables are quantitative variables. Coupon number, type of restaurant, name of restaurant, and item are categorical variables.
![]()
An appropriate label for your cases should be chosen carefully. In our food coupon example, a natural choice of a label would be the name of the restaurant. However, if there are two or more coupons available for a particular restaurant, or if a restaurant is a chain with different discounts offered at different locations, then the name of the restaurant would not uniquely label each of the coupons. In the restaurant discount coupon file, the first variable, ID, is a unique label for each coupon.
spreadsheet
The display in Figure 1.1 is from an Excel spreadsheet. Spreadsheets are very useful for doing the kind of simple computations that you will do in Exercise 1.2. You can type in a formula and have the same computation performed for each row.
![]()
Note that the names we have chosen for the variables in our spreadsheet do not have spaces. For example, instead of “Restaurant Name” for the name of the restaurant, we simply use Name. In some statistical software packages, however, spaces are not allowed in variable names. For this reason, when creating spreadsheets for eventual use with statistical software, it is best to avoid spaces in variable names. Another convention is to use an underscore (_) where you would normally use a space. For our data set, we could have used Regular_Price and Discount_Price for the two price variables.
USE YOUR KNOWLEDGE
Use Your Knowledge
Question 1.1
1.1 Read the spreadsheet. Refer to Figure 1.1. Give the regular price and the discount price for the Smokey Grill ribs coupon.
1.2 How much is the discount worth? Refer to Example 1.1. Consider adding another column to the spreadsheet that gives the coupon savings. Explain how you would compute the entries in this column. Does the new column contain values for a categorical variable or for a quantitative variable? Explain your answer.
4
unit of measurement
Another important part of the description of any quantitative variable is its unit of measurement. For both RegPrice and DiscPrice, the unit of measurement is clearly dollars. In other settings, it may not be as obvious.
For example, if we were measuring heights of children, we might choose to use either inches or centimeters. The units of measurement are an important part of the description of a quantitative variable.
Key characteristics of a data set
In practice, any set of data is accompanied by background information that helps us understand the data. When you plan a statistical study or explore data from someone else’s work, ask yourself the following questions:
Who? What cases do the data describe? How many cases does the data set contain?
What? How many variables do the data contain? What are the exact definitions of these variables? What are the units of measurement for each quantitative variable?
Why? What purpose do the data have? Do we hope to answer some specific questions? Do we want to draw conclusions about cases other than the ones we actually have data for? Are the variables that are recorded suitable for the intended purpose?
EXAMPLE 1.3
Statistics class data. Suppose that you are a teaching assistant for a statistics class and one of your jobs is to keep track of the grades for students in two sections of the course. The cases are the students in the class. There are weekly homework assignments, two exams during the semester, and a final exam. Each of these components is given a numerical score, and the components are added to get a total score that can range from 0 to 1000. Cutoffs of 900, 800, 700, etc., are used to assign letter grades of A, B, C, etc.

The spreadsheet for this course will have seven variables:
An identifier for each student.
The number of points earned for homework.
The number of points earned for the first exam.
The number of points earned for the second exam.
The number of points earned for the final exam.
The total number of points earned.
The letter grade earned.
The student identifier is a label and the letter grade earned is a categorical variable. All the other variables are measured in “points.” Because we can do arithmetic with their values, these variables are quantitative variables.
In our example of statistics class data, the possible values for the grade variable are A, B, C, D, and F. When computing grade point averages, many colleges and universities translate these letter grades into numbers using , , , , and . The transformed variable with numeric values is considered to be quantitative because we can average the numerical values across different courses to obtain a grade point average.
5
USE YOUR KNOWLEDGE
Use Your Knowledge
Question 1.2
1.3 Who, what, and why? For the restaurant discount coupon data of Example 1.1 (page 2), what cases do the data describe? How many cases are there? How many variables are there? What are their definitions and units of measurement? What purpose do the data have?
6
EXAMPLE 1.6
Comparing colleges based on graduates. Think about comparing colleges based on the numbers of graduates. This view tells you something about the relative sizes of different colleges. However, if you are interested in how well colleges succeed at graduating students they admit, it would be better to use a rate. For example, you can find data on the Internet on the six-year graduation rates of different colleges. These rates are computed by examining the progress of first-year students who enroll in a given year. Suppose that at College A there were 1000 first-year students in a particular year, and 800 graduated within six years. The graduation rate is
or 80%. College B has 2000 students who entered in the same year, and 1200 graduated within six years. The graduation rate is
or 60%. How do we compare these two colleges? College B has more graduates but College A has a better graduation rate.
adjusting one variable to create another
In Example 1.6, when we computed the graduation rate, we used the total number of students to adjust the number of graduates. We constructed a new variable by dividing the number of graduates by the total number of students. Computing a rate is just one of several ways of adjusting one variable to create another. We often divide one variable by another to compute a more meaningful variable to study. Example 1.20 (page 20) is another type of adjustment.