3.6 Investigating the Brain
So far, you’ve read a great deal about the nervous system: how it’s organized, how it works, what its components are, and what those components do. But one question remains largely unanswered: How do we know all of this? Anatomists can dissect a human brain and identify its structures, but they cannot determine which structures play a role in producing which behaviors by dissecting a nonliving brain.
Scientists use a variety of methods to understand how the brain affects behavior. Let’s consider three of the main ones: studying people with brain damage; studying the brain’s electrical activity; and using brain imaging to study brain structure and watch the brain in action. Let’s examine each of these ways of investigating the brain.
Studying the Damaged Brain
How have brain disorders been central to the study of specific areas of the brain?
To understand the normal operation of a process better, it is instructive to understand what happens when that process fails. Much research in neuroscience correlates the loss of specific perceptual, motor, emotional, or cognitive functions with specific areas of brain damage (Andrewes, 2001; Kolb & Whishaw, 2003). By studying these instances, neuroscientists can theorize about the functions those brain areas normally perform. The modern history of neuroscience can be dated to the work of Paul Broca (see the Psychology: Evolution of a Science chapter). In 1861, Broca described a patient who had lost the capacity to produce spoken language (but not the ability to understand language) due to damage in a small area in the left frontal lobe. In 1874, Carl Wernicke (1848–1905) described a patient with an impairment in language comprehension (but not the ability to produce speech) associated with damage to an area in the upper-
115
The Emotional Functions of the Frontal Lobes
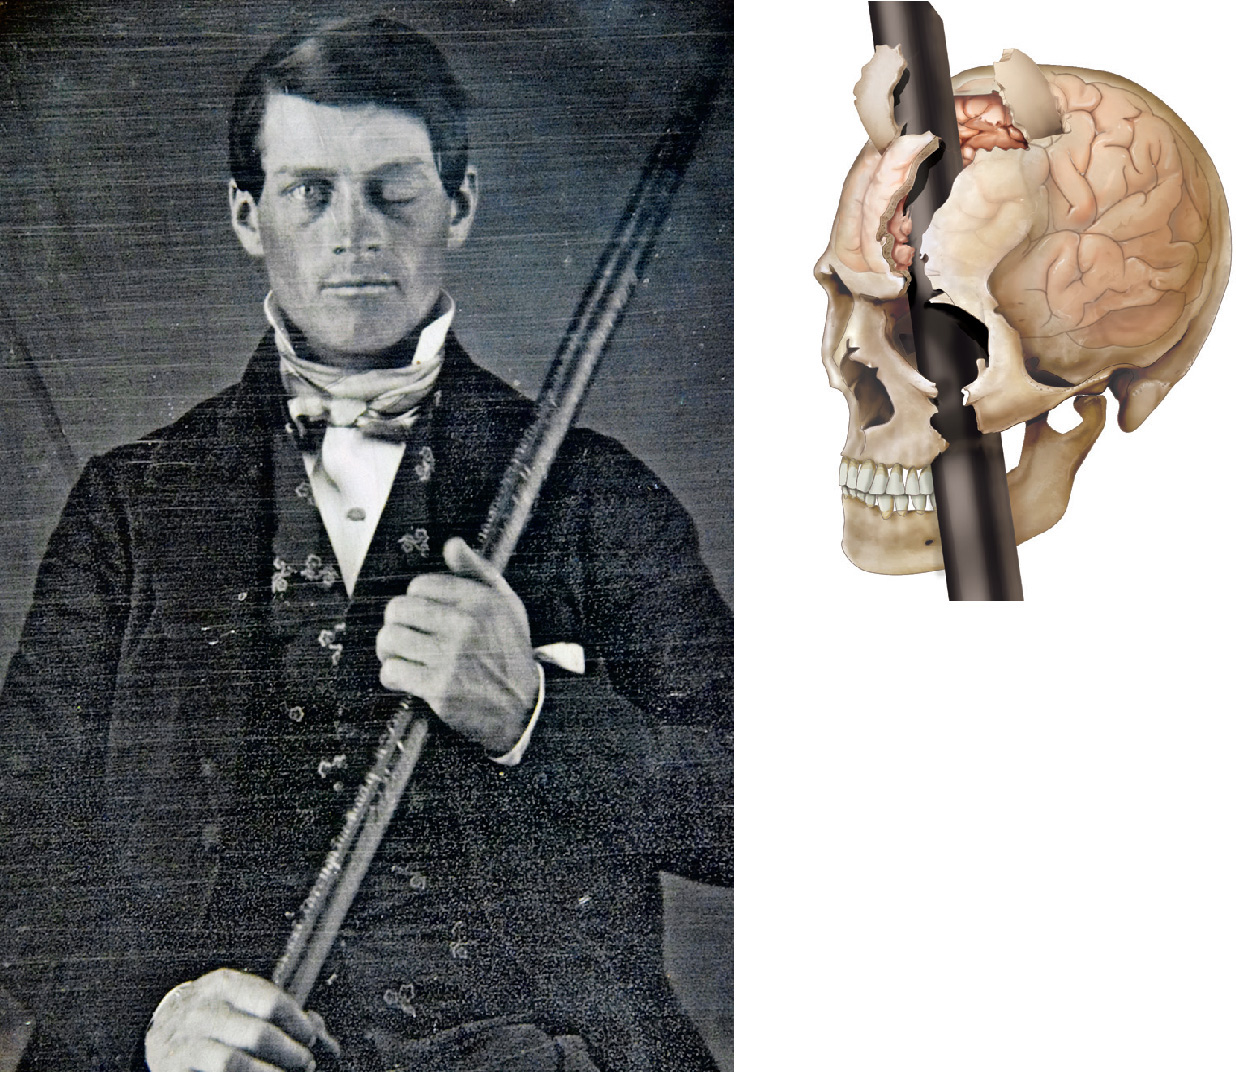
As you’ve already seen, the human frontal lobes are a remarkable evolutionary achievement. However, psychology’s first glimpse at some functions of the frontal lobes came from a rather unremarkable fellow; so unremarkable, in fact, that a single event in his life defined his place in the annals of psychology’s history (Macmillan, 2000). Phineas Gage was a muscular 25-
Before the accident, Gage had been mild mannered, quiet, conscientious, and a hard worker. After the accident, however, he became irritable, irresponsible, indecisive, and given to profanity. The sad decline of Gage’s personality and emotional life nonetheless provided an unexpected benefit to psychology. His case study was the first to allow researchers to investigate the hypothesis that the frontal lobe is involved in emotion regulation, planning, and decision making. Furthermore, because the connections between the frontal lobe and the subcortical structures of the limbic system were affected, scientists were able to understand better how the amygdala, hippocampus, and related brain structures interacted with the cerebral cortex (Damasio, 2005).
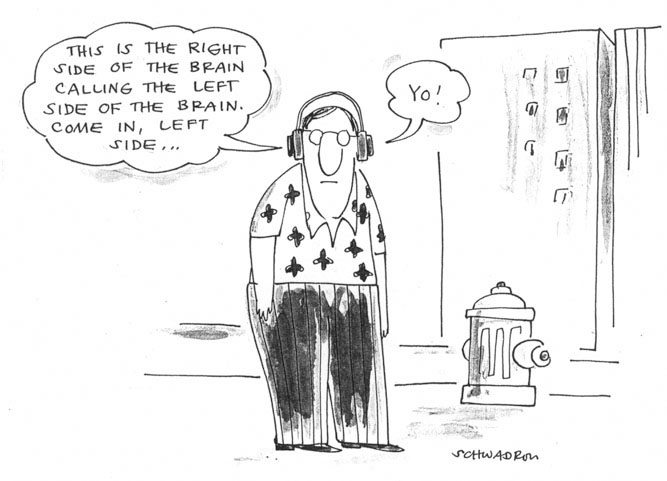
The Distinct Roles of the Left and Right Hemispheres
You’ll recall that the cerebral cortex is divided into two hemispheres, although typically the two hemispheres act as one integrated unit. Sometimes, though, disorders can threaten the ability of the brain to function, and the only way to stop them is with radical methods. This is sometimes the case for people who suffer from severe, intractable epilepsy. Seizures that begin in one hemisphere cross the corpus callosum (the thick band of nerve fibers that allows the two hemispheres to communicate) to the opposite hemisphere and start a feedback loop that results in a kind of firestorm in the brain. To alleviate the severity of the seizures, surgeons can sever the corpus callosum in a procedure called a split-
116
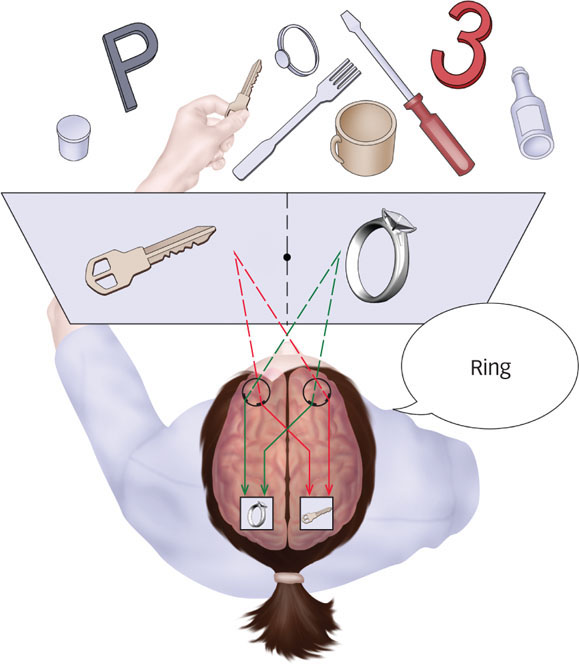
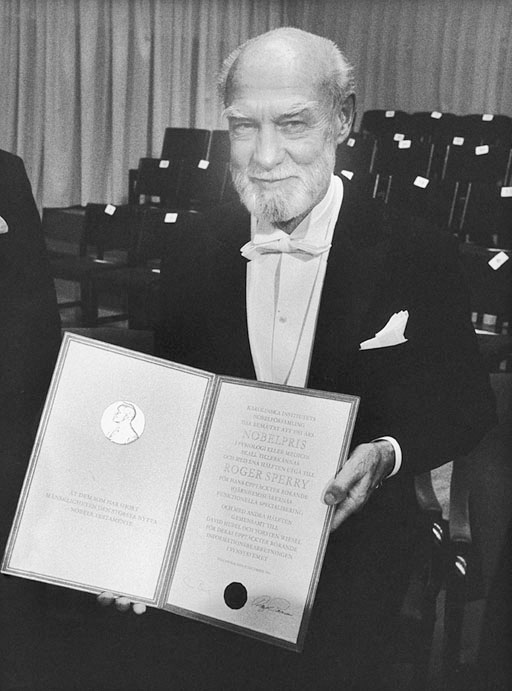
Nobel laureate Roger Sperry (1913–1994) was intrigued by the observation that the everyday behavior of people who had their corpus collosum severed did not seem to be affected by the operation. Did this mean that the corpus callosum played no role at all in behavior? Sperry thought that this conclusion was premature, reasoning that casual observations of everyday behaviors could easily fail to detect impairments that might be picked up by sensitive tests. To evaluate this idea experimentally, Sperry and his colleagues first showed that when the corpus callosum was severed in cats, learning was not transferred from one hemisphere to the other (Sperry, 1964). Later, Sperry designed several experiments that investigated the behaviors of people with split brains, and in the process, revealed a great deal about the independent functions of the left and right hemispheres (Sperry, 1964). Normally, any information that initially enters the left hemisphere is also registered in the right hemisphere and vice versa: The information comes in and travels across the corpus callosum, and both hemispheres understand what’s going on (see FIGURE 3.25). But in a person with a split brain, information entering one hemisphere stays there. Without an intact corpus callosum, there’s no way for that information to reach the other hemisphere. Sperry and his colleagues used this understanding of lateralized perception in a series of experiments. For example, they had a person with a split brain look at a spot in the center of a screen and then projected a stimulus either on the left side of the screen (the left visual field) or the right side of the screen (the right visual field), isolating the stimulus to the opposite hemisphere (see Figure 4.10 in the Sensation and Perception chapter for more details about how information from one visual field enters the opposite hemisphere).
What role does the corpus callosum play in behavior?
The hemispheres themselves are specialized for different kinds of tasks. You just learned about Broca’s and Wernicke’s areas, which revealed that language processing is largely a left-
Of course, information presented to the right hemisphere would produce complementary deficits. In this case, she might be presented with a familiar object in her left hand (e.g., a key), be able to demonstrate that she knew what it was (by twisting and turning the key in midair), yet be unable to verbally describe what she was holding. In this case, the information in the right hemisphere is unable to travel to the left hemisphere, which controls the production of speech.
117
Furthermore, suppose a person with a split brain was shown the unusual face in FIGURE 3.26. This is called a chimeric face, and it is assembled from half-
These split-
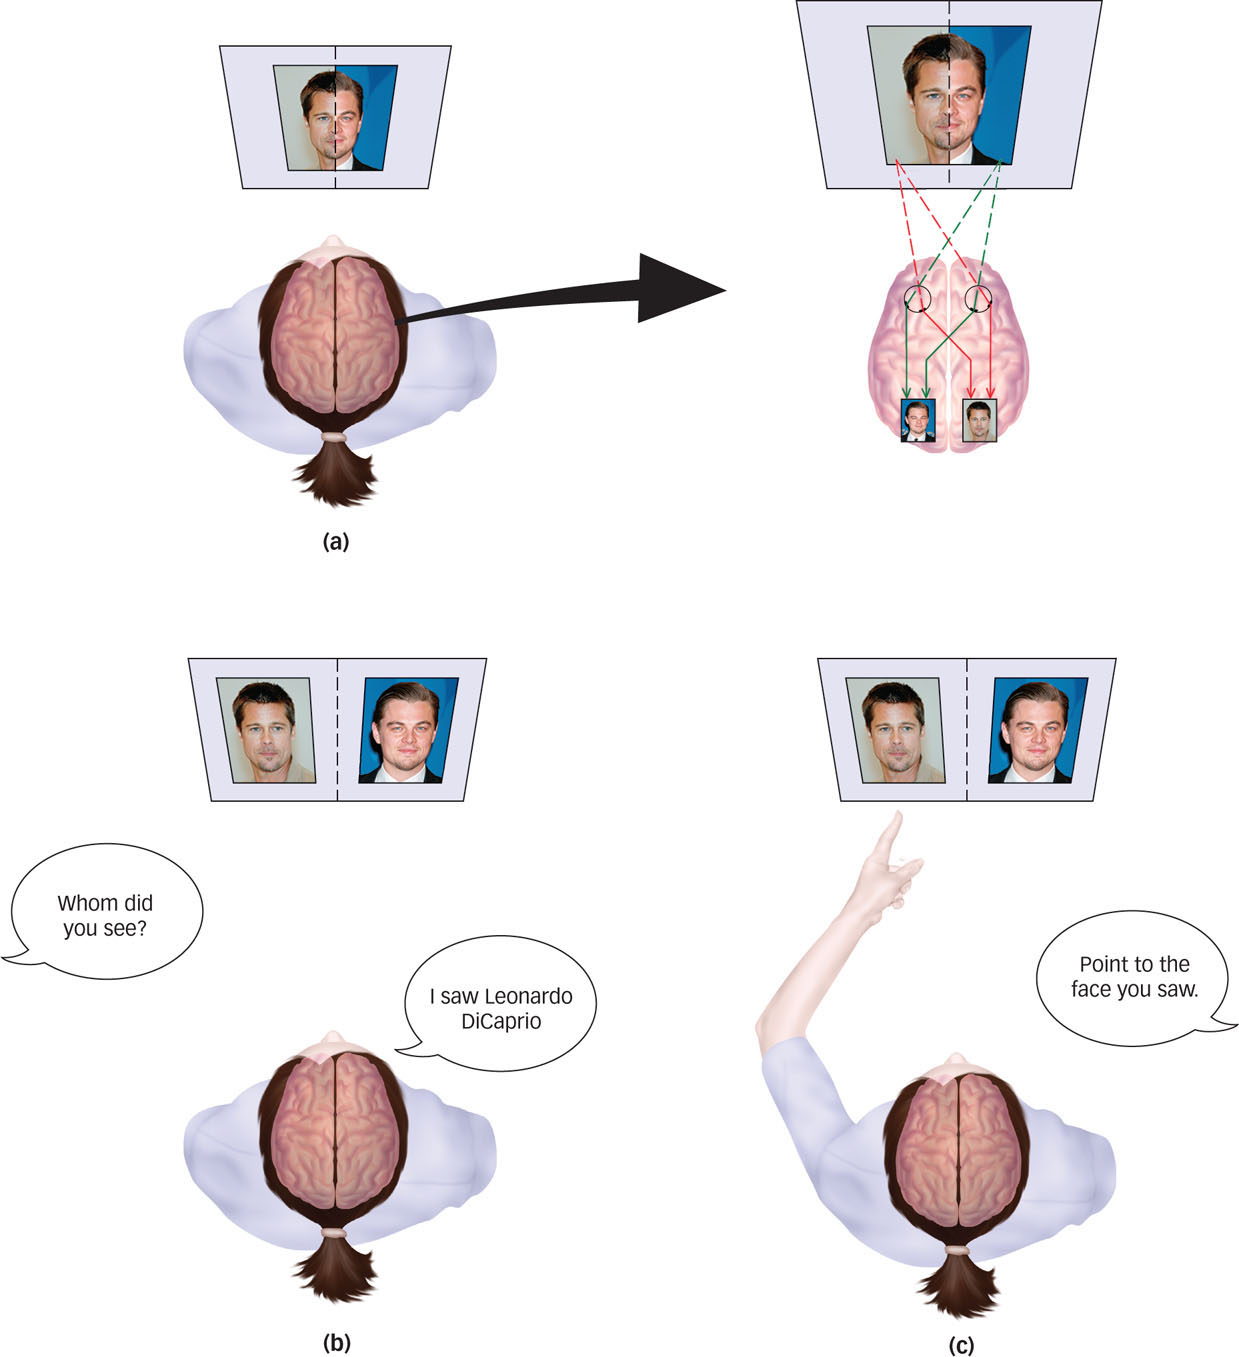
PHOTO OF LEONARDO DICAPRIO: AP PHOTO/TAMMIE ARROYO
118
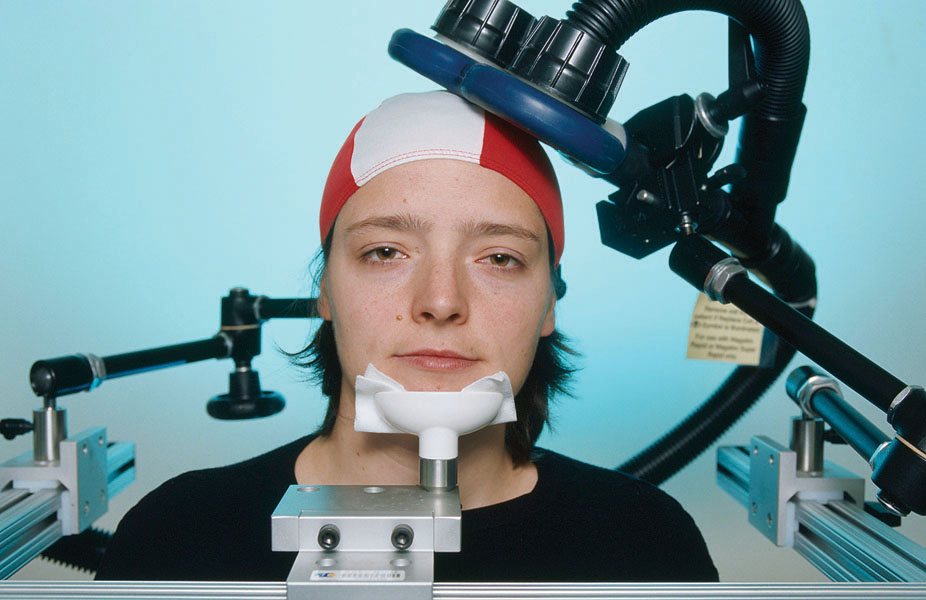
Studying the Brain’s Electrical Activity
How does the EEG record electrical activity in the brain?
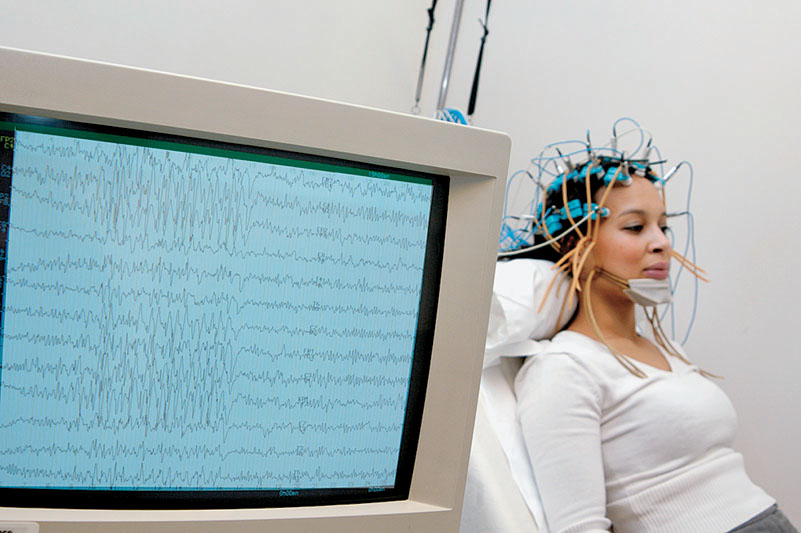
electroencephalograph (EEG) A device used to record electrical activity in the brain.
A second approach to studying the link between brain structures and behavior involves recording the pattern of electrical activity of neurons. An electroencephalograph (EEG) is a device used to record electrical activity in the brain. Typically, electrodes are placed on the outside of the head, and even though the source of electrical activity in synapses and action potentials is far removed from these wires, the electric signals can be amplified several thousand times by the EEG. This provides a visual record of the underlying electrical activity, as shown in FIGURE 3.27. Using this technique, researchers can determine the amount of brain activity during different states of consciousness. For example, as you’ll read in the Consciousness chapter, the brain shows distinctive patterns of electrical activity when awake versus asleep; in fact, there are even different brain-
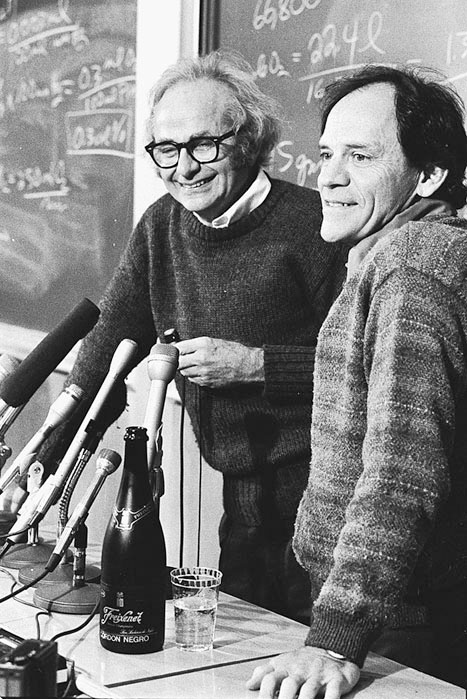
A different approach to recording electrical activity resulted in a more refined understanding of the brain’s division of responsibilities, even at a cellular level. Nobel laureates David Hubel and Torsten Wiesel used a technique that inserted electrodes into the occipital lobes of anesthetized cats and observed the patterns of action potentials of individual neurons (Hubel, 1988). Hubel and Wiesel amplified the action potential signals through a loudspeaker so that the signals could be heard as clicks as well as seen on an oscilloscope. While flashing lights in front of the animal’s eye, Hubel and Wiesel recorded the resulting activity of neurons in the occipital cortex. What they discovered was not much of anything: Most of the neurons did not respond to this kind of general stimulation. This was frustrating to them. Hubel (1988, p. 69) recalled years later that “we tried everything short of standing on our heads to get it to fire,” but then they began to notice something interesting.
Nearing the end of what seemed like a failed set of experiments, they projected a glass slide that contained a black dot in front of the cat’s eyes and heard a brisk flurry of clicks as the neurons in the cat’s occipital lobe fired away! Observing carefully, they realized that the firing did not have anything to do with the black dot, but instead was produced by a faint but sharp shadow cast by the edge of the glass slide. They discovered that neurons in the primary visual cortex are activated whenever a contrast between light and dark occurs in part of the visual field, seen particularly well when the visual stimulus was a thick line of light against a dark background. In this case, the shadow caused by the edge of the slide provided the kind of contrast that prompted particular neurons to respond. They then found that each neuron responded vigorously only when presented with a contrasting edge at a particular orientation. Since then, many studies have shown that neurons in the primary visual cortex represent particular features of visual stimuli, such as contrast, shape, and color (Zeki, 1993).
These neurons in the visual cortex are known as feature detectors because they selectively respond to certain aspects of a visual image. For example, some neurons fire only when detecting a vertical line in the middle of the visual field, other neurons fire when a line at a 45° angle is perceived, and still others in response to wider lines, horizontal lines, lines in the periphery of the visual field, and so on (Livingstone & Hubel, 1988). The discovery of this specialized function for neurons was a huge leap forward in our understanding of how the visual cortex works. Feature detectors identify basic dimensions of a stimulus (“slanted line…other slanted line…horizontal line”); those dimensions are then combined during a later stage of visual processing to allow recognition and perception of a stimulus (“Oh, it’s a letter A”).
119
Other studies have identified a variety of features that are detected by sensory neurons. For example, some visual processing neurons in the temporal lobe are activated only when detecting faces (Kanwisher, 2000; Perrett, Rolls, & Caan, 1982). Neurons in this area are specialized for processing faces; damage to this area results in an inability to perceive faces. These complementary observations (showing that the type of function that is lost or altered when a brain area is damaged corresponds to the kind of information processed by neurons in that cortical area) provide the most compelling evidence linking the brain to behavior.
Using Brain Imaging to Study Structure and to Watch the Brain in Action
The third major way that neuroscientists can peer into the workings of the human brain has only become possible within the past several decades. EEG readouts give an overall picture of a person’s level of consciousness, and single-
Structural Brain Imaging
One of the first neuroimaging techniques developed was the computerized axial tomography (CT) scan. In a CT scan, a scanner rotates a device around a person’s head and takes a series of X-
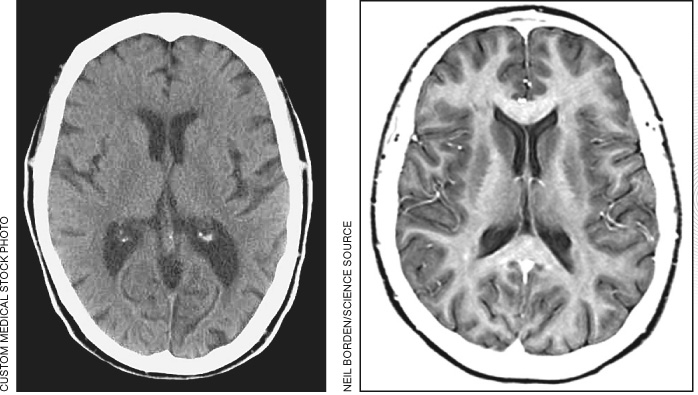
Magnetic resonance imaging (MRI) uses a strong magnetic field to line up the nuclei of specific molecules in the brain tissue. Brief, but powerful, pulses of radio waves cause the nuclei to rotate out of alignment. When a pulse ends, the nuclei snap back in line with the magnetic field and give off a small amount of energy in the process. Different molecules have unique energy signatures when they snap back in line with the magnetic field, so these signatures can be used to reveal brain structures with different molecular compositions. MRI produces pictures of soft tissue at a better resolution than a CT scan, as you can see in Figure 3.28. These techniques give psychologists a clearer picture of the structure of the brain and can help localize brain damage (as when someone suffers a stroke), but they reveal nothing about the functions of the brain.
120
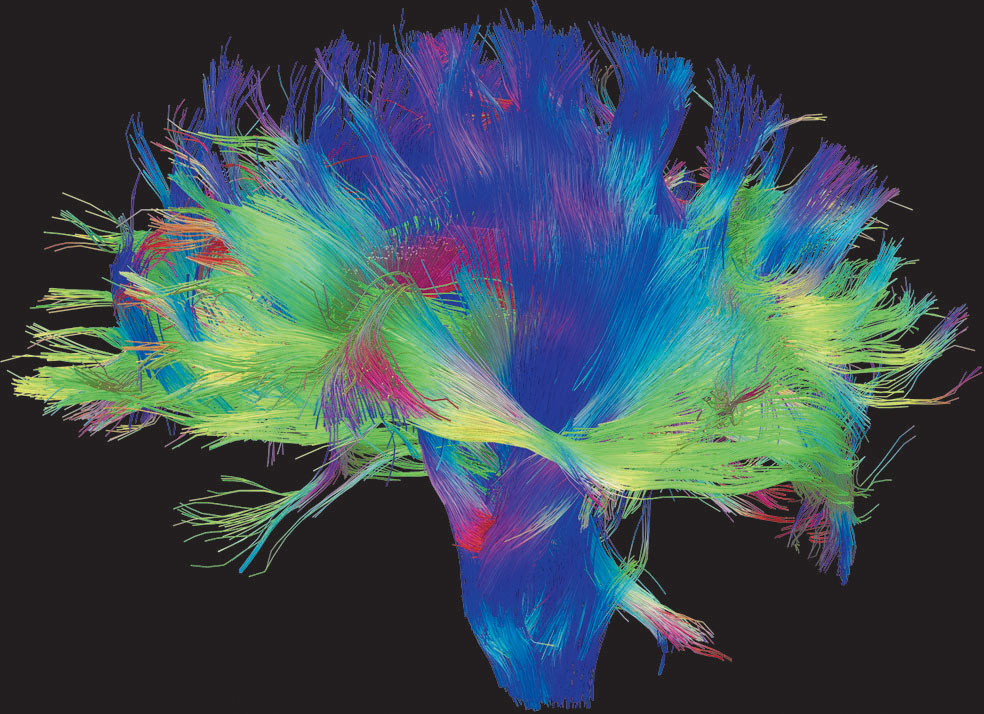
Diffusion tensor imaging (DTI) is a relatively recently developed type of MRI that is used to visualize white matter pathways, which are fiber bundles that connect both nearby and distant brain regions to one another. DTI measures the rate and direction of diffusion or movement of water molecules along white matter pathways. Because the diffusion of water molecules follows the direction of the pathway, information about the direction in which water molecules diffuse can be used to determine where a white matter pathway goes. Scientists can use measures based on the rate and direction of diffusion to assess the integrity of a white matter pathway, which is very useful in cases of neurological and psychological disorders (Thomason & Thompson, 2011).
Because DTI provides information about pathways that connect brain areas to one another, it is a critical tool in mapping the connectivity of the human brain, and plays a central role in an ambitious undertaking known as the Human Connectome Project. This is a collaborative effort funded by the National Institutes of Health beginning in 2009 that involves a partnership between researchers at Massachusetts General Hospital and UCLA, and another partnership between researchers at Washington University and the University of Minnesota. The main goal of the project is to provide a complete map of the connectivity of neural pathways in the brain: the human connectome (Toga et al., 2012). A unique and exciting feature of the Human Connectome Project is that the researchers have made available some of their results at their Web site (www.humanconnectomeproject.org), which include fascinating colorful images of some of the connection pathways they have discovered.
Functional Brain Imaging
Functional brain imaging techniques show researchers much more than just the structure of the brain by allowing us to watch the brain in action. These techniques rely on the fact that activated brain areas demand more energy for their neurons to work. This energy is supplied through increased blood flow to the activated areas. Functional imaging techniques can detect such changes in blood flow. In positron emission tomography (PET), a harmless radioactive substance is injected into a person’s bloodstream. Then the brain is scanned by radiation detectors as the person performs perceptual or cognitive tasks, such as reading or speaking. Areas of the brain that are activated during these tasks demand more energy and greater blood flow, resulting in a higher amount of the radioactivity in that region. The radiation detectors record the level of radioactivity in each region, producing a computerized image of the activated areas (see FIGURE 3.29). Note that PET scans differ from CT scans and MRIs in that the image produced shows activity in the brain while the person performs certain tasks. So, for example, a PET scan of a person speaking would show activation in Broca’s area in the left frontal lobe.
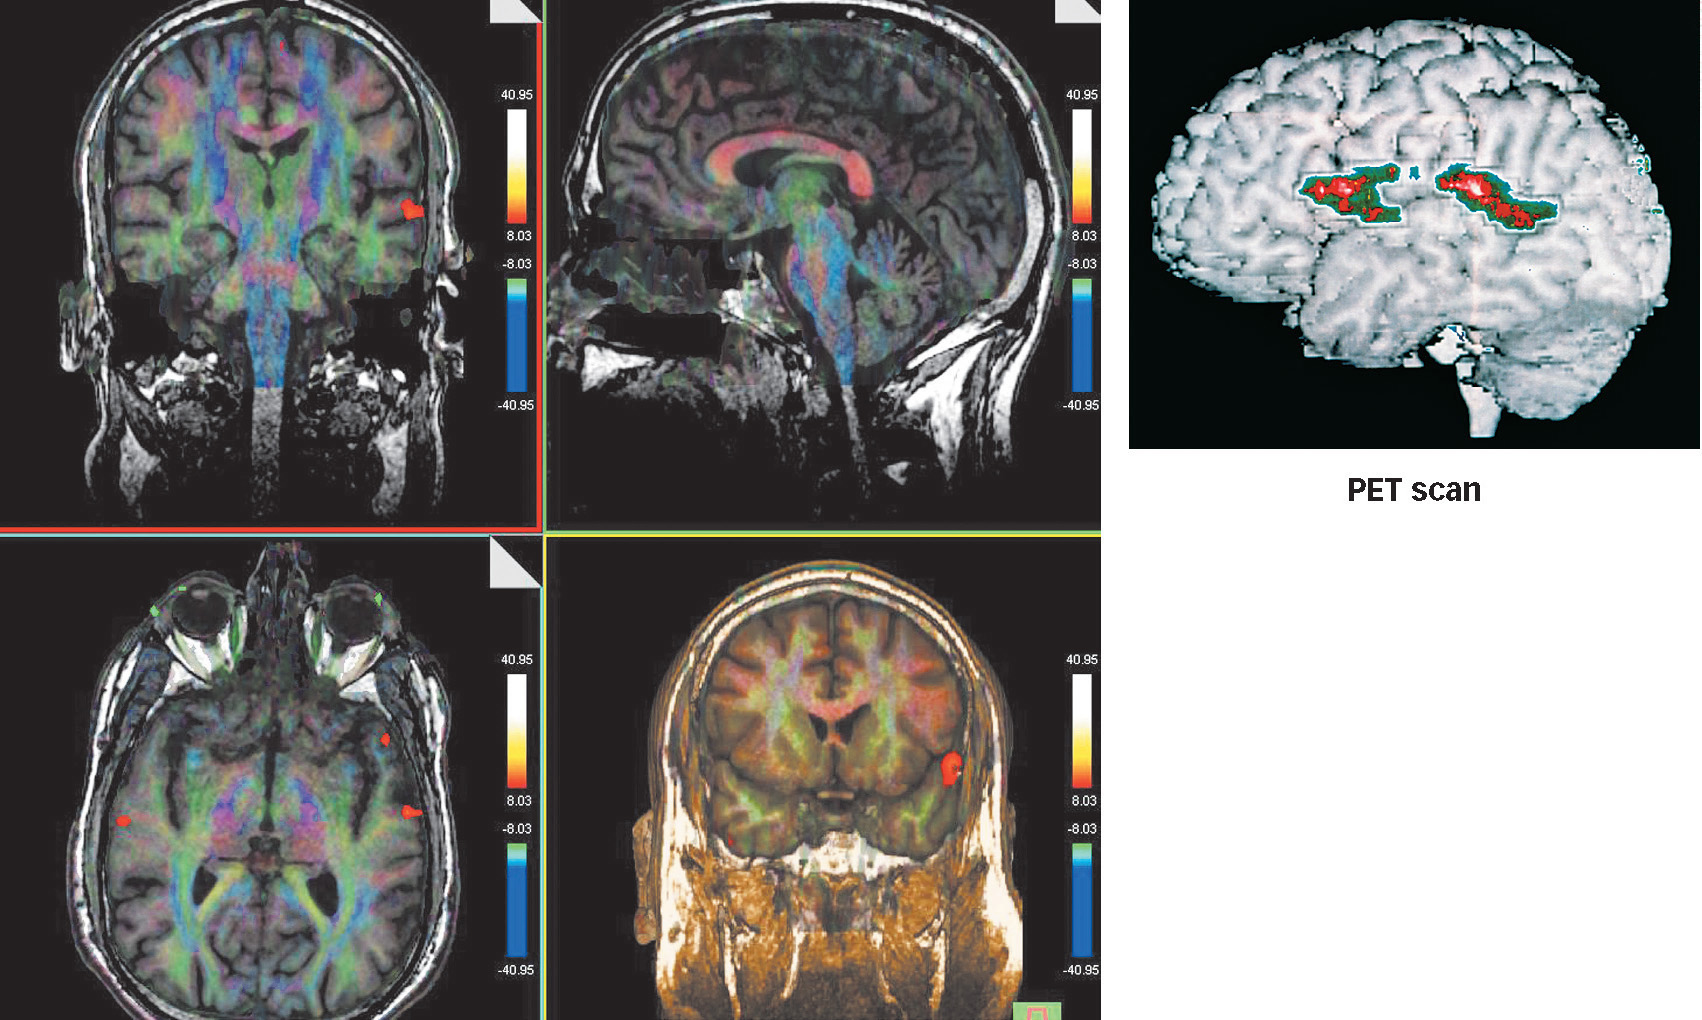
For psychologists, the most widely used functional brain imaging technique nowadays is functional magnetic resonance imaging (fMRI), which detects the difference between oxygenated hemoglobin and deoxygenated hemoglobin when exposed to magnetic pulses. Hemoglobin is the molecule in the blood that carries oxygen to our tissues, including the brain. When active neurons demand more energy and blood flow, oxygenated hemoglobin concentrates in the active areas; fMRI detects the oxygenated hemoglobin and provides a picture of the level of activation in each brain area (see Figure 3.29). Just as MRI was a major advance over CT scans, functional MRI represents a similar leap in our ability to record the brain’s activity during behavior. Both fMRI and PET allow researchers to localize changes in the brain very accurately. However, fMRI has a couple of advantages over PET. First, fMRI does not require any exposure to a radioactive substance. Second, fMRI can localize changes in brain activity across briefer periods than PET, which makes it more useful for analyzing psychological processes that occur extremely quickly, such as reading a word or recognizing a face. With PET, researchers often have to use experimental designs different from those they would use in the psychology laboratory in order to adapt to the limitations of PET technology. With fMRI, researchers can design experiments that more closely resemble the ones they carry out in the psychology laboratory.
What does an fMRI track in an active brain?
121
Functional MRI can also be used to explore the relationship of brain regions with one another, using a recently developed technique referred to as resting state functional connectivity. As implied by the name, this technique does not require participants to perform a task; they simply rest quietly while fMRI measurements are made. Functional connectivity measures the extent to which spontaneous activity in different brain regions is correlated over time; brain regions whose activity is highly correlated are thought to be functionally connected with one another (Lee, Smyser, & Shimony, 2012). Functional connectivity measures have been used extensively in recent years to identify brain networks, that is, sets of brain regions that are closely connected to one another (Yeo et al., 2011). For example, functional connectivity helped to identify the default network (Gusnard & Raichle, 2001), a group of interconnected regions in the frontal, temporal, and parietal lobes that is involved in internally focused cognitive activities, such as remembering past events, imagining future events, daydreaming, and mind wandering (Andrews-
122
Insights from Functional Imaging
PET and fMRI provide remarkable insights into the types of information processing that take place in specific areas of the brain. For example, when a person performs a simple perceptual task, such as looking at a circular checkerboard, the primary visual areas are activated. As you have read, when the checkerboard is presented to the left visual field, the right visual cortex shows activation, and when the checkerboard is presented to the right visual field, the left visual cortex shows activation (Fox et al., 1986). Similarly, when people look at faces, fMRI reveals strong activity in a region located near the border of the temporal and occipital lobes called the fusiform gyrus (Kanwisher, McDermott, & Chun, 1997). When this structure is damaged, people experience problems with recognizing faces—
You’ll recall from the Methods chapter that at the heart of the scientific method is the relationship between ideas and evidence. There is no statute of limitations on scientific investigation. In this case, these modern brain imaging techniques confirm the theories derived from studies of brain damage from over 100 years ago. When Broca and Wernicke reached their conclusions about language production and language comprehension, they had little more to go on than some isolated cases and good hunches. PET scans have since confirmed that different areas of the brain are activated when a person is listening to spoken language, reading words on a screen, saying words out loud, or thinking of related words. This suggests that different parts of the brain are activated during these related but distinct functions. Similarly, it was pretty clear to the physician who examined Phineas Gage that the location of Gage’s injuries played a major role in his drastic change in personality and emotionality. fMRI scans have since confirmed that the frontal lobe plays a central role in regulating emotion. It’s always nice when independent methods (in these instances, very old case studies and very recent technology) arrive at the same conclusions. As you’ll also see at various points in the text, brain imaging techniques such as fMRI are also revealing new and surprising findings, such as the insights described in the Real World box (Brain Death and the Vegetative State).
Why should we avoid jumping to conclusions based on fMRI results?
Although the insights that we are obtaining from fMRI are exciting, it is important that we don’t get too carried away with them, as sometimes happens in media depictions of fMRI results (Marcus, 2012). Consider, as an example, the topic of memory accuracy and distortion. Using experimental paradigms that you’ll learn about in the chapter on Memory, fMRI studies have shown that activity in some parts of the brain is greater during the retrieval of accurate rather than inaccurate memories (Schacter & Loftus, 2013). Does that mean we are ready to use fMRI in the courtroom to determine whether a witness is recounting an accurate memory or an inaccurate memory? Schacter and Loftus argued that the answer to this question is an emphatic no. For example, we don’t yet know whether the results of laboratory fMRI studies of memory, which typically use simple materials like words or pictures, generalize to the kinds of complex everyday events that are relevant in the courtroom. Furthermore, evidence that fMRI can distinguish accurate from inaccurate memories comes from studies in which brain activity is averaged across a group of participants. But in the courtroom we need to determine whether an individual is remembering accurately or not, and there is little evidence yet that fMRI can do so. More generally, it is important to think carefully about how fMRI evidence is obtained before leaping to conclusions about how that evidence can be used in everyday life.
123
THE REAL WORLD: Brain Death and the Vegetative State
In 1981, the President’s Commission for the Study of Ethical Problems in Medicine and Biomedical and Behavioral Research defined brain death as the irreversible loss of all functions of the brain. Contrary to what you may think, brain death is not the same as being in a coma or being unresponsive to stimulation. Indeed, even a flatline EEG does not indicate that all brain functions have stopped; the reticular formation in the hindbrain, which generates spontaneous respiration and heartbeat, may still be active.
Brain death came to the forefront of national attention in the case of Terri Schiavo, a woman who had been kept alive on a respirator for nearly 15 years in a Florida nursing home. She died on March 31, 2005, after the feeding tube that sustained her was removed. A person like Schiavo is commonly referred to as brain dead, but such an individual is more accurately described as being in a persistent vegetative state. Does a persistent vegetative state qualify as “life”? Consider this: Neuroimaging research has found evidence that people diagnosed as being in a vegetative state show signs of intentional mental activity (Monti, 2012). In one study, researchers used fMRI to observe the patterns of brain activity in a 25-
The researchers suggested that these findings are evidence for, at least, conscious understanding of spoken commands and, at best, a degree of intentionality in an otherwise vegetative person. The patient’s brain activity while “playing tennis” and “walking through her house” revealed that she could both understand the researchers’ instructions and willfully complete them. A more recent fMRI study that used these and related mental imagery tasks in a much larger sample found evidence for willful modulation of brain activity in 5 of 54 patients with disorders of consciousness (Monti et al., 2010). Other recent studies have revealed evidence of normal cerebral responses to language and complex sounds in 2 out of 3 patients in a vegetative state (Fernandez-
Transcranial Magnetic Stimulation
We noted earlier that scientists have learned a lot about the brain by studying the behavior of people with brain injuries. But, although brain damage may be related to particular patterns of behavior, that relationship may or may not be causal. Experimentation is the premier method for establishing causal relationships between variables, but scientists cannot ethically cause brain damage in human beings, thus they have not been able to establish causal relationships between particular kinds of brain damage and particular patterns of behavior. Functional neuroimaging techniques such as fMRI don’t help on this point because they do not provide information about when a particular pattern of brain activity causes a particular behavior.
Happily, scientists have discovered a way to mimic brain damage with a benign technique called transcranial magnetic stimulation (TMS; Barker, Jalinous, & Freeston, 1985; Hallett, 2000). If you’ve ever held a magnet under a piece of paper and used it to drag a pin across the paper’s surface, you know that magnetic fields can pass through insulating material. The human skull is no exception. TMS delivers a magnetic pulse that passes through the skull and deactivates neurons in the cerebral cortex for a short period. Researchers can direct TMS pulses to particular brain regions (essentially turning them off) and then measure temporary changes in the way a person moves, sees, thinks, remembers, speaks, or feels. By manipulating the state of the brain, scientists can perform experiments that establish causal relationships.
124
OTHER VOICES: Neuromyths

You’ve no doubt often heard the phrase “we only use 10% of our brains,” and perhaps you’ve wondered whether there is anything to it. Chabris and Simons (2012) discussed this and other statements about the brain that they believe to be merely myths, based in part, on a recent study by Dekker et al. (2012).
Pop quiz: Which of these statements is false?
- We use only 10% of our brain.
- Environments rich in stimuli improve the brains of preschool children.
- Individuals learn better when they receive information in their preferred learning style, whether auditory, visual, or kinesthetic.
If you picked the first one, congratulations. The idea that we use only 10% of our brain is patently false. Yet it so permeates popular culture that, among psychologists and neuroscientists, it is known as the “10% myth.” Contrary to popular belief, the entire brain is put to use—
Did you agree with the other two statements? If so, you fell into our trap. All three statements are false—
These “neuromyths,” along with others, were presented to 242 primary and secondary school teachers in the Netherlands and the United Kingdom as part of a study by Sanne Dekker and colleagues at VU University Amsterdam and Bristol University, and just published in the journal Frontiers in Psychology. They found that 47% of the teachers believed the 10% myth. Even more, 76%, believed that enriching children’s environments will strengthen their brains.
This belief might have emerged from evidence that rats raised in cages with amenities like exercise wheels, tunnels, and other rats showed better cognitive abilities and improvements in brain structure compared with rats that grew up isolated in bare cages. But such experiments show only that a truly impoverished and unnatural environment leads to poorer developmental outcomes than a more natural environment with opportunities to play and interact. It follows that growing up locked in a closet or otherwise cut off from human contact will impair a child’s brain development. It does not follow that “enriching” a child’s environment beyond what is already typical (e.g., by constant exposure to “Baby Einstein”-type videos) will boost cognitive development.
The myth about learning styles was the most popular: 94% of the teachers believed that students perform better when lessons are delivered in their preferred learning style. Indeed, students do have preferences about how they learn; the problem is that these preferences have little to do with how effectively they learn….
Our own surveys of the U.S. population have found even more widespread belief in myths about the brain. About two-
Ironically, in the Dekker group’s study, the teachers who knew the most about neuroscience also believed in the most myths. Apparently, teachers who are (admirably) enthusiastic about expanding their knowledge of the mind and brain have trouble separating fact from fiction as they learn. Neuromyths have so much intuitive appeal, and they spread so rapidly in fields like business and self-
If for some perverse reason you wanted to annoy the instructor of your psychology course, you probably could do no better than to claim that “we use only 10% of our brains.” Even though, as pointed out by Chabris and Simon (2012), a surprisingly high proportion of elementary and secondary schoolteachers in the Netherlands and the United Kingdom subscribe to this myth, we don’t know any psychologists teaching courses like the one you are taking who would endorse it, and we hope that there aren’t any. How did the myth get started? Nobody really knows. Some think it may have arisen from a quotation by the great psychologist William James (“We are making use of only a small part of our possible mental and physical resources”) or that it possibly owes to Albert Einstein’s attempt to make sense of his own massive intellect (Boyd, 2008).
The key point for our purposes is that when you hear such bold claims made, say, by a friend who heard it from somebody else, it’s time for you to put into action the kinds of critical thinking skills that we are focusing on in this text, and start asking questions: What’s the evidence for the claim? Is there a specific study or studies that your friend can name to provide evidence in support of the claim? Are any such studies published in peer-
Reprinted by permission of the Wall Street Journal, Copyright © 2012 Dow Jones & Company, Inc. All Rights Reserved Worldwide. License numbers 3185501478402 and 3185510077103.
125
For example, in an early study using TMS, scientists discovered that magnetic stimulation of the visual cortex temporarily impairs a person’s ability to detect the motion of an object without impairing the person’s ability to recognize that object (Beckers & Zeki, 1995). This intriguing discovery suggests that motion perception and object recognition are accomplished by different parts of the brain, but moreover, it establishes that activity in the visual cortex causes motion perception. More recent research has revealed that applying TMS to the specific part of the visual cortex responsible for motion perception also impairs the accuracy with which people reach for moving objects (Schenk et al., 2005) or for stationary objects when there is motion in the background of a visual scene (Whitney et al., 2007). These findings indicate that the visual motion area plays a crucial role in guiding actions when we’re responding to motion in the visual environment.
Rather than relying solely on observational studies of people with brain injuries or the snapshots provided by fMRI or PET scans, researchers can also manipulate brain activity and measure its effects. Scientists have also begun to combine TMS with fMRI, allowing them to localize precisely where in the brain TMS is having its effect (Caparelli, 2007). Studies suggest that TMS has no harmful side effects (Anand & Hotson, 2002; Pascual-
 There are three major approaches to studying the link between the brain and behavior:
-
Observing how perceptual, motor, intellectual, and emotional capacities are affected following brain damage. By carefully relating specific psychological and behavioral disruptions to damage in particular areas of the brain, researchers can better understand how the brain area normally plays a role in producing those behaviors.
-
Examining global electrical activity in the brain and the activity patterns of single neurons. The patterns of electrical activity in large brain areas can be examined from outside the skull using the electroencephalograph (EEG). Single-
cell recordings taken from specific neurons can be linked to specific perceptual or behavioral events, suggesting that those neurons represent particular kinds of stimuli or control particular aspects of behavior. -
Using brain imaging to scan the brain as people perform different perceptual or intellectual tasks. Correlating energy consumption in particular brain areas with specific cognitive and behavioral events suggests that those brain areas are involved in specific types of perceptual, motor, cognitive, or emotional processing.
126