9.5 Decision Making: Rational and Otherwise
We use categories and concepts to guide the hundreds of decisions and judgments we make during the course of an average day. Some decisions are easy (what to wear, what to eat for breakfast, and whether to walk, ride a bicycle, or drive to class) and some are more difficult (which car to buy, which apartment to rent, who to hang out with on Friday night, and even which job to take after graduation). Some decisions are made based on sound judgments. Others are not.
The Rational Ideal
Economists contend that if we are rational and are free to make our own decisions, we will behave as predicted by rational choice theory: We make decisions by determining how likely something is to happen, judging the value of the outcome, and then multiplying the two (Edwards, 1955). This means that our judgments will vary depending on the value we assign to the possible outcomes. Suppose, for example, you were asked to choose between a 10% chance of gaining $500 and a 20% chance of gaining $2,000. The rational person would choose the second alternative because the expected payoff is $400 ($2,000 × 20%), whereas the first offers an expected gain of only $50 ($500 × 10%). Selecting the option with the highest expected value seems so straightforward that many economists accept the basic ideas in rational choice theory. But how well does this theory describe decision making in our everyday lives? In many cases, the answer is not very well.
The Irrational Reality
Is the ability to classify new events and objects into categories always a useful skill? Alas, no. These strengths of human decision making can turn into weaknesses when certain tasks inadvertently activate these skills. In other words, the same principles that allow cognition to occur easily and accurately can pop up to bedevil our decision making.
Judging Frequencies and Probabilities
Consider the following list of words:
block table block pen telephone block disk glass table block telephone block watch table candy
Why is a better decision more likely when considering frequency, versus likelihood, that something will happen?
You probably noticed that the words block and table occurred more frequently than the other words did. In fact, studies have shown that people are quite good at estimating frequency, or simply the number of times something will happen. This skill matters quite a bit when it comes to decision making. In contrast, we perform poorly on tasks that require us to think in terms of probabilities, or the likelihood that something will happen.
Even with probabilities, however, performance varies depending on how the problem is described. In one experiment, 100 physicians were asked to predict the incidence of breast cancer among women whose mammogram screening tests showed possible evidence of breast cancer. The physicians were told to take into consideration the rarity of breast cancer (1% of the population at the time the study was done) and radiologists’ record in diagnosing the condition (correctly recognized only 79% of the time and falsely diagnosed almost 10% of the time). Of the 100 physicians, 95 estimated the probability that cancer was present to be about 75%! The correct answer was 8%. The physicians apparently experienced difficulty taking so much information into account when making their decision (Eddy, 1982). Similar dismal results have been reported with a number of medical screening tests (Hoffrage & Gigerenzer, 1996; Windeler & Kobberling, 1986).
375
However, dramatically different results were obtained when the study was repeated using frequency information instead of probability information. Stating the problem as “10 out of every 1,000 women actually have breast cancer” instead of “1% of women actually have breast cancer” led 46% of the physicians to derive the right answer, compared to only 8% who came up with the right answer when the problem was presented using probabilities (Hoffrage & Gigerenzer, 1998). This finding suggests, at a minimum, that when seeking advice (even from a highly skilled decision maker), make sure your problem is described using frequencies rather than probabilities.
Availability Bias
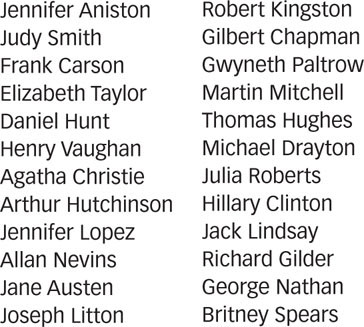
Take a look at the list of names in FIGURE 9.10. Now look away from the book and estimate the number of male names and female names in the figure. Did you notice that some of the women on the list are famous and none of the men are? Was your estimate off because you thought the list contained more women’s than men’s names (Tversky & Kahneman, 1973, 1974)? The reverse would have been true if you had looked at a list with the names of famous men and unknown women because people typically fall prey to availability bias: Items that are more readily available in memory are judged as having occurred more frequently.
How are memory strength and frequency of occurrence related?
The availability bias affects our estimates because memory strength and frequency of occurrence are directly related. Frequently occurring items are remembered more easily than infrequently occurring items, so you naturally conclude that items for which you have better memory must also have been more frequent. Unfortunately, better memory in this case was not due to greater frequency, but to greater familiarity.
Shortcuts such as the availability bias are sometimes referred to as heuristics, fast and efficient strategies that may facilitate decision making but do not guarantee that a solution will be reached. Heuristics are mental shortcuts, or “rules of thumb,” that are often–but not always–effective when approaching a problem (Swinkels, 2003). In contrast, an algorithm is a well-
The first procedure is an intelligent heuristic that may be successful, but you could continue searching your memory until you finally run out of time or patience. The second strategy is a series of well-
The Conjunction Fallacy
The availability bias illustrates a potential source of error in human cognition. Unfortunately, it’s not the only one. Consider the following description:
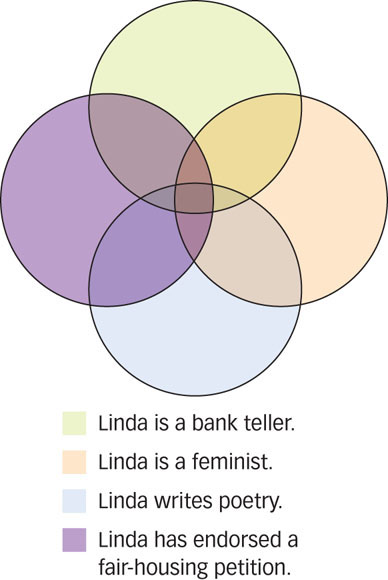
Linda is 31 years old, single, outspoken, and very bright. In college, she majored in philosophy. As a student, she was deeply concerned with issues of discrimination and social justice and also participated in antinuclear demonstrations.
Which state of affairs is more probable?
a. Linda is a bank teller.
b. Linda is a bank teller and is active in the feminist movement.
376
In one study, 89% of participants rated option b as more probable than option a (Tversky & Kahneman, 1983), although that’s logically impossible. Let’s say there’s a 20% chance that Linda is a bank teller; after all, there are plenty of occupations she might hold. Independently, let’s say there’s also a 20% chance that she’s active in the feminist movement; she probably has lots of interests. The joint probability that both things are true simultaneously is the product of their separate probabilities. In other words, the 20% chance that she’s a teller multiplied by the 20% chance that she’s in the feminist movement produces a 4% chance that both things are true at the same time (.20 × .20 = .04, or 4%). The combined probability of events is always less than the independent probability of each event; therefore, it’s always more probable that any one state of affairs is true than is a set of events simultaneously.
How can more information sometimes lead people to wrong conclusions?
This is called the conjunction fallacy because people think that two events are more likely to occur together than either individual event. The fallacy is that with more and more pieces of information, people think there’s a higher probability that all are true. Actually, the probability diminishes rapidly. Based on her description, do you think Linda also voted for the liberal candidate in the last election? Do you think she also writes poetry? Do you think she’s also signed her name to fair-
Representativeness Heuristic
Think about the following situation:
A panel of psychologists wrote 100 descriptions based on interviews with engineers and lawyers. THE DESCRIPTIONS CAME FROM 70 ENGINEERS AND 30 LAWYERS. You will be shown a random selection of these descriptions. Read each and then pause and decide if it is more likely that the person is an engineer or a lawyer. Note your decision and read on.
1. Jack enjoys reading books on social and political issues. During the interview, he displayed particular skill at argument.
2. Tom is a loner who enjoys working on mathematical puzzles during his spare time. During the interview, his speech remained fairly abstract and his emotions were well controlled.
3. Harry is a bright man and an avid racquetball player. During the interview, he asked many insightful questions and was very well spoken.
Research participants were shown a series of descriptions like these and asked after each one to judge the likelihood that the person described was a lawyer or an engineer (Kahneman & Tversky, 1973). Remember, of the descriptions, 70 were engineers and 30 were lawyers. If participants took this proportion into consideration, their judgments should have reflected the fact that there were more than twice as many engineers as lawyers. But researchers found that people didn’t use this information and based their judgments solely on how closely the description matched their concepts of lawyers and engineers. So, the majority of participants thought descriptions such as 1 were more likely to be lawyers, those like 2 were more likely to be engineers, and those like 3 could be either.
Consider participants’ judgments about Harry. His description doesn’t sound like a lawyer’s or an engineer’s, so most people said he was equally likely to hold either occupation. But the pool contains more than twice as many engineers as lawyers, so it is far more likely that Harry is an engineer. People seem to ignore information about base rate, or the existing probability of an event, basing their judgments on similarities to categories. Researchers call this the representativeness heuristic: making a probability judgment by comparing an object or event to a prototype of the object or event (Kahneman & Tversky, 1973). Thus, the probability judgments were skewed toward the participants’ prototypes of lawyer and engineer. The greater the similarity, the more likely they were judged to be members of that category despite the existence of much more useful base rates.
What can cause people to ignore the base rate of an event?
377
Heuristics such as availability, representativeness, or the conjunction fallacy highlight both the strengths and weaknesses of the way we think. We are very good at forming categories based on prototypes and making classification judgments on the basis of similarity to prototypes. Judging probabilities is not our strong suit. As we saw earlier in this chapter, the human brain easily processes frequency information, and decision-
Framing Effects

Is a 70% success rate better than a 30°% failure rate?
You’ve seen that, according to rational choice theory, our judgments will vary depending on the value we place on the expected outcome. So how effective are we at assigning value to our choices? Studies show that framing effects, which occur when people give different answers to the same problem depending on how the problem is phrased (or framed), can influence the assignment of value.
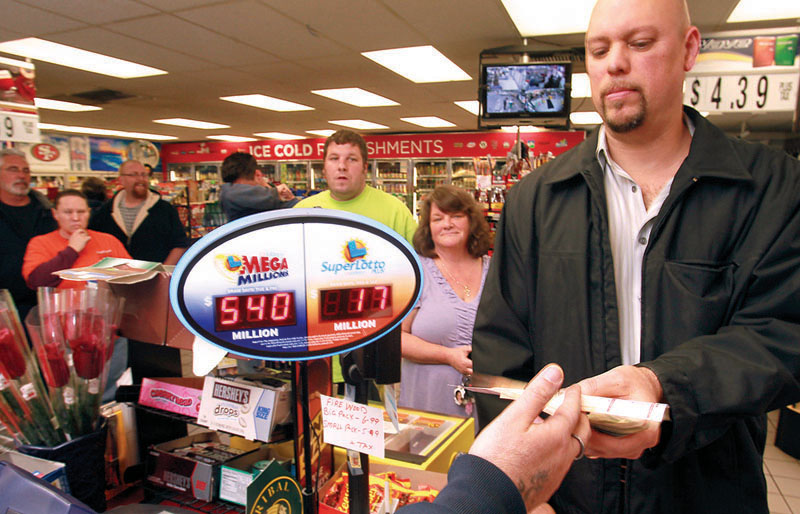
For example, if people are told that a particular drug has a 70% effectiveness rate, they’re usually pretty impressed: 70% of the time the drug cures what ails you sounds like a good deal. Tell them instead that a drug has a 30% failure rate–30% of the time it does no good–and they typically perceive it as risky, potentially harmful, and something to be avoided. Notice that the information is the same: A 70% effectiveness rate means that 30% of the time, it’s ineffective. The way the information is framed, however, leads to substantially different conclusions (Tversky & Kahneman, 1981).
One of the most striking framing effects is the sunk-
Notice that you have two choices: (1) Spend $100 and stay comfortably at home or (2) spend $100 and endure many uncomfortable hours in the rain. The $100 is gone in either case: It’s a sunk cost, irretrievable at the moment of your decision. But the way you framed the problem created a problem: Because you invested time and money, you feel obligated to follow through, even though it’s something you no longer want. If you can turn off this feeling and ask, would I rather spend $100 to be comfortable or spend it to be miserable? the smart choice is clear: Stay home and listen to the podcast!
Even the National Basketball Association (NBA) is guilty of a sunk-
378
CULTURE & COMMUNITY: Does culture influence optimism bias?
In addition to heuristics and biases described in this chapter, human decision making often reflects the effects of optimism bias: People believe that they are more likely to experience positive events and less likely to experience Inegative events in the future, compared with other people (Sharot, 2011; Weinstein, 1980). (Several studies have found that optimism bias is greater in North Americans than in individuals from eastern cultures such as Japan (Heine & Lehman, 1995; Klein & Helwig-
Findings such as these may ultimately be helpful in attempting to understand why the I optimism bias occurs. Although many possibilities have been suggested (Sharot, 2011), researchers haven’t yet come up with a theory that explains all the relevant evidence. Focusing on cultural similarities and differences in optimism bias may help to achieve that goal, plthough we shouldn’t be unrealistically optimistic that we will achieve it anytime soon!
Why Do We Make Decision-Making Errors?
As you have seen, everyday decision making seems riddled with errors and shortcomings. Our decisions vary wildly depending on how a problem is presented (e.g., frequencies vs. probabilities or framed in terms of losses rather than savings), and we seem to be prone to fallacies, such as the sunk-
Prospect Theory
Why will most people take more risks to avoid losses than to make gains?
According to a totally rational model of inference, people should make decisions that maximize value; in other words, they should seek to increase what psychologists and economists call expected utility. We face decisions like this every day. If you are making a decision that involves money and money is what you value, then you should choose the outcome that is likely to bring you the most money. When deciding which of two apartments to rent, you’d compare the monthly expenses for each and choose the one that leaves more money in your pocket.
As you have seen, however, people often make decisions that are inconsistent with this simple principle. The question is, why? To explain these effects, Amos Tversky and Daniel Kahneman (1992) developed prospect theory: People choose to take on risk when evaluating potential losses and avoid risks when evaluating potential gains. These decision processes take place in two phases.
 First, people simplify available information. So, in a task like choosing an apartment, they tend to ignore a lot of potentially useful information because apartments differ in so many ways (the closeness of restaurants, the presence of a swimming pool, the color of the carpet, and so forth). Comparing each apartment on each factor is simply too much work; focusing only on differences that matter is more efficient.
-
In the second phase, people choose the prospect that they believe offers the best value. This value is personal and may differ from an objective measure of “best value.” For example, you might choose the apartment with higher rent because you can walk to eight great bars and restaurants.
Prospect theory makes other assumptions that account for people’s choice patterns. One assumption, called the certainty effect, suggests that when making decisions, people give greater weight to outcomes that are a sure thing. When deciding between playing a lottery with an 80% chance of winning $4,000 or receiving $3,000 outright, most people choose the $3,000, even though the expected value of the first choice is $200 more ($4,000 × 80% = $3,200)! Apparently, people weigh certainty much more heavily than expected payoffs when making choices.
Prospect theory also assumes that in evaluating choices, people compare them to a reference point. For example, suppose you’re still torn between two apartments. The $400 monthly rent for apartment A is discounted $10 if you pay before the fifth of the month. A $10 surcharge is tacked onto the $390 per month rent for apartment B if you pay after the fifth of the month. Although the apartments are objectively identical in terms of cost, different reference points may make apartment A seem psychologically more appealing than apartment B.
Prospect theory also assumes that people are more willing to take risks to avoid losses than to achieve gains. Given a choice between a definite $300 rebate on your first month’s rent or spinning a wheel that offers an 80% chance of getting a $400 rebate, you’ll most likely choose the lower sure payoff over the higher potential payoff ($400 × 80% = $320). However, given a choice between a sure fine of $300 for damaging an apartment or spinning a wheel that has an 80% chance of a $400 fine, most people will choose the higher potential loss over the sure loss. This asymmetry in risk preferences shows that we are willing to take on risk if we think it will ward off a loss, but we’re risk-
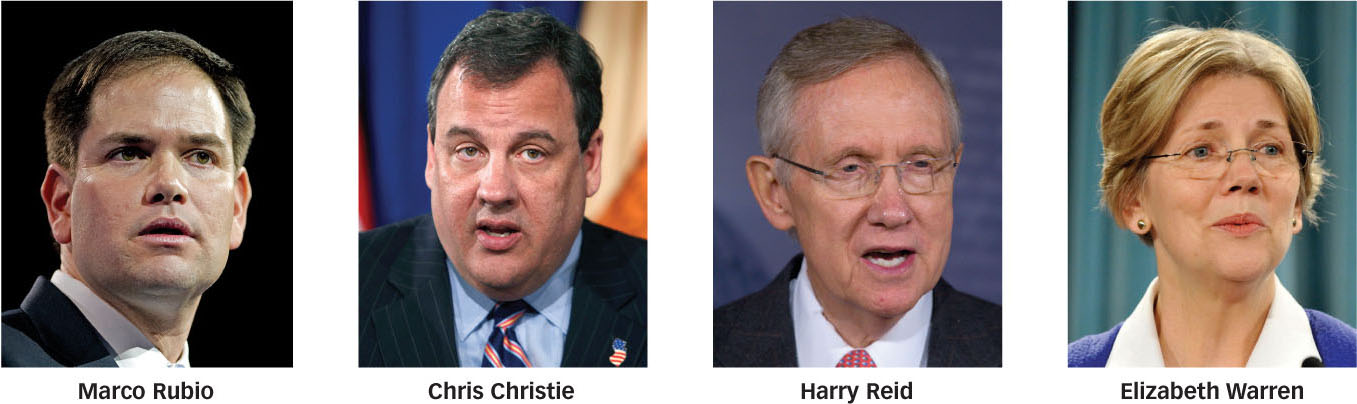
AP PHOTO/MEL EVANS, FILE
AP PHOTO/HARRY HAMBURG
ZUMA PRESS/ALAMY
Frequency Format Hypothesis
Why are we better at estimating frequencies than probabilities?
According to the frequency format hypothesis, our minds evolved to notice how frequently things occur, not how likely they are to occur (Gigerenzer, 1996; Gigerenzer & Hoffrage, 1995). Thus, we interpret, process, and manipulate information about frequency with comparative ease because that’s the way quantitative information usually occurs in natural circumstances. For example, the 20 men, 15 women, 5 dogs, 13 cars, and 2 bicycle accidents you encountered on the way to class came in the form of frequencies, not probabilities or percentages. Probabilities and percentages are, evolutionarily speaking, recent developments, emerging in the mid-
380
In contrast, people can track frequencies virtually effortlessly and flawlessly (Hasher & Zacks, 1984). We are also remarkably good at recognizing how often two events occur together (Mandel & Lehman, 1998; Spellman, 1996; Waldmann, 2000). Infants as young as 6 months of age can tell the difference between displays that differ in the number of items present (Starkey, Spelke, & Gelman, 1983, 1990). Frequency monitoring is a basic biological capacity rather than a skill learned through formal instruction. According to the frequency format hypothesis, presenting statistical information in frequency format rather than probability format results in improved performance because it capitalizes on our evolutionary strengths (Gigerenzer & Hoffrage, 1995; Hertwig & Gigerenzer, 1999).
Decision Making and the Brain
A man identified as Elliot (whom you met briefly in the Psychology: Evolution of a Science chapter) was a successful businessman, husband, and father prior to developing a brain tumor. After surgery, his intellectual abilities seemed intact, but he was unable to differentiate between important and unimportant activities and would spend hours at mundane tasks. He lost his job and got involved in several risky financial ventures that bankrupted him. He had no difficulty discussing what had happened, but his descriptions were so detached and dispassionate that it seemed as though his abstract intellectual functions had become dissociated from his social and emotional abilities.
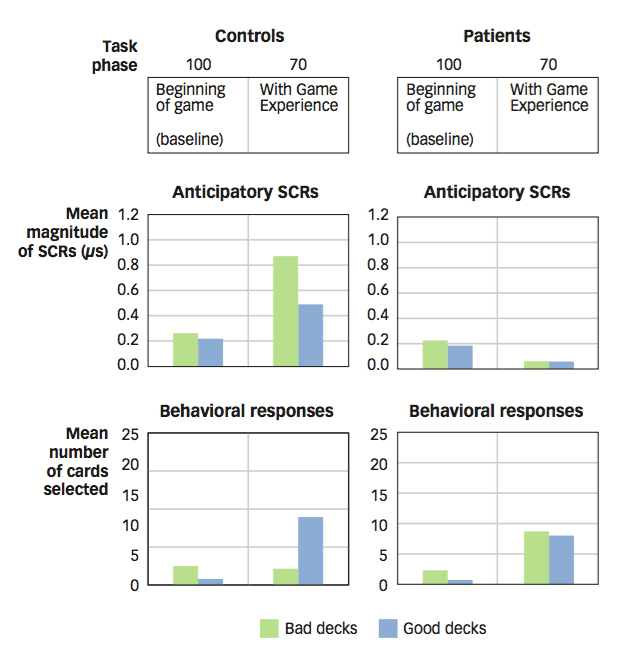
Research confirms that this interpretation of Elliot’s downfall is right on track. In one study, researchers looked at how healthy volunteers differed from people with prefrontal lobe damage on a gambling task that involves risky decision making (Bechara et al., 1994, 1997). Four decks of cards were placed face down, and participants were required to make 100 selections of cards that specified an amount of play money they could win or lose. Two of the decks usually provided large payoffs or large losses, whereas the other two provided smaller payoffs and losses. While playing the game, the participants’ galvanic skin responses (GSRs) were recorded to measure heightened emotional reactions.
The performance of players with prefrontal lobe damage mirrored Elliot’s real-
What is the relationship of the prefrontal cortex to risky behavior?
Further studies of the participants with prefrontal damage suggest that their risky decision making grows out of insensitivity to the future consequences of their behavior (Naqvi, Shiv, & Bechara, 2006). Unable to think beyond immediate consequences, they could not shift their choices in response to a rising rate of losses or a declining rate of rewards (Bechara, Tranel, & Damasio, 2000). Interestingly, substance-
381
Neuroimaging studies of healthy individuals have provided evidence that fits well with the earlier studies of individuals with damage to the prefrontal cortex: When performing the gambling task, an area in the prefrontal cortex is activated when participants need to make risky decisions as compared to safe decisions. Indeed, the activated region is in the part of the prefrontal cortex that is typically damaged in participants who perform poorly on the gambling task, and greater activation in this region is correlated with better task performance in healthy individuals (Fukui et al., 2005; Lawrence et al., 2009). Taken together, the neuroimaging and lesion studies show clearly that aspects of risky decision making depend critically on the contributions of the prefrontal cortex.
382
 Human decision making often departs from a completely rational process, and the mistakes that accompany this departure tell us a lot about how the human mind works.
-
The values we place on outcomes weigh so heavily in our judgments that they sometimes overshadow objective evidence. When people are asked to make probability judgments, they will turn the problem into something they know how to solve, such as judging memory strength, judging similarity to prototypes, or estimating frequencies. This can lead to errors of judgment.
-
When a problem fits their mental algorithms, people show considerable skill at making appropriate judgments. In making a judgment about the probability of an event, performance can vary dramatically.
-
Because we feel that avoiding losses is more important than achieving gains, framing effects can affect our choices. Emotional information also strongly influences our decision making, even when we are not aware of it. Although this influence can lead us astray, it often is crucial for making decisions in everyday life.
-
The prefrontal cortex plays an important role in decision making, and patients with prefrontal damage make more risky decisions than do non-
brain- damaged indiviuals.