2.3 Explanation: Discovering Why People Do What They Do
It would be interesting to know whether happy people are healthier than unhappy people. However, it would be even more interesting to know why. Does happiness make people healthier? Does being healthy make people happier? Does being wealthy make people healthy and happy? These are the kinds of questions scientists often wish to answer, and scientists have developed some clever ways of using their measurements to do just that. In the first section (Correlation), we will examine techniques that can tell us whether two things are related. In the second section (Causation), we will examine techniques that can tell us whether the relationship between two things is causal. In the third section (Drawing Conclusions), we will see what kinds of conclusions these techniques do—
2.3.1 Correlation
How much sleep did you get last night? Now, how many capital cities around the world can you name? If you asked a dozen university students those two questions, you would probably find that the students who got a good night’s sleep are better capital city namers than are students who pulled an all-
|
Participant |
Hours of Sleep |
No. of Capital Cities Named |
|---|---|---|
|
A |
0 |
11 |
|
B |
0 |
17 |
|
C |
2.7 |
16 |
|
D |
3.1 |
21 |
|
E |
4.4 |
17 |
|
F |
5.5 |
16 |
|
G |
7.6 |
31 |
|
H |
7.9 |
41 |
|
I |
8 |
40 |
|
J |
8.1 |
35 |
|
K |
8.6 |
38 |
|
L |
9 |
43 |
52
2.3.1.1 Patterns of Variation
Measurements tell us about the properties of objects and events. We can learn about the relationships between those objects and events by comparing the patterns of variation in a series of measurements. When you asked university students questions about sleep and capital cities, you actually did three things:
How can we tell if two variables are correlated?
First, you measured a pair of variables, which are properties whose values can vary across individuals or over time. (When you took your first algebra course you were probably horrified to learn that everything you would been taught in elementary school about the distinction between letters and numbers was a lie, that mathematical equations could contain Xs and Ys as well as 7s and 4s, and that the letters are called variables because they can have different values under different circumstances. Same idea here.) You measured one variable (number of hours slept) whose value could vary from 0 to 24, and you measured a second variable (number of capital cities named) whose value could vary from 0 to 196.
Second, you did this again. And then again. And then again. That is, you made a series of measurements rather than making just one.
Third and finally, you tried to discern a pattern in your series of measurements. If you look at the second column of Table 2.1, you will see that it contains values that vary as your eyes move down the column. That column has a particular pattern of variation. If you compare the third column with the second, you will notice that the patterns of variation in the two columns are synchronized: in this case, both increase as you move from top to bottom (see FIGURE 2.7). This synchrony is known as a pattern of covariation or a correlation (as in “co-
relation”). Two variables are said to “covary” or be “correlated” when variations in the value of one variable are synchronized with variations in the value of the other. As the values in the second column vary from small to large, the values in the third column do the same. 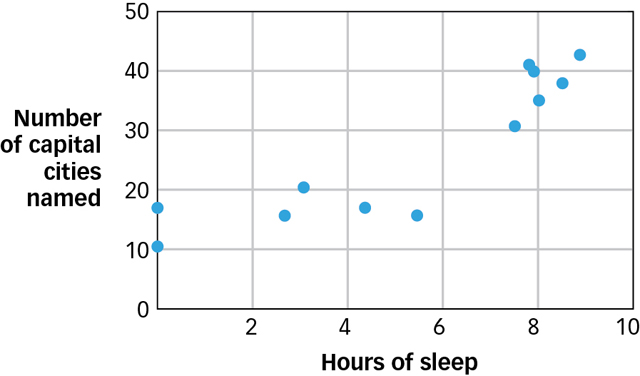 Figure 2.7: Pattern between Amount of Sleep and Memory The graph shows the pattern in the data of Table 2.1 between hours of sleep and number of capital cities named.
By looking for synchronized patterns of variation, we can use measurement to discover the relationships between variables. Indeed, this is the only way anyone has ever discovered the relationship between variables, which is why most of the facts you know about the world can be thought of as correlations. For example, you know that people who smoke generally die younger than people who do not, but this is just a shorthand way of saying that as the value of cigarette consumption increases, the value of longevity decreases. Correlations not only describe the world as it is, they also allow us to predict the world as it will be. For example, given the correlation between smoking and longevity, you can predict with some confidence that a young person who starts smoking today will probably not live as long as a young person who does not start. In short, when two variables are correlated, knowledge of the value of one variable allows us to make predictions about the value of the other variable.
2.3.1.2 Measuring the Direction and Strength of a Correlation
If you predict that a sleep-
Direction is easy to measure because the direction of a correlation is either positive or negative. A positive correlation exists when two variables have a “more-
53

How can correlations be measured?
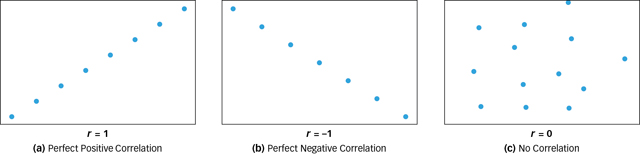
The direction of a correlation is easy to measure, but the strength is a little more complicated. The correlation coefficient is a mathematical measure of both the direction and strength of a correlation and it is symbolized by the letter r (as in “relationship”). Like most measures, the correlation coefficient has a limited range. What does that mean? Well, if you were to measure the number of hours of sunshine per day in your hometown, that number could range from 0 to 24. Numbers such as −7 and 36.8 would be meaningless. Similarly, the value of r can range from −1 to 1, and numbers outside that range are meaningless. What, then, do the numbers inside that range mean?
If every time the value of one variable increases by a fixed amount the value of the second variable also increases by a fixed amount, then the relationship between the variables is called a perfect positive correlation and r = 1 (see FIGURE 2.8a). For example, if every 30-
minute increase in sleep was associated with a 2- capital- city increase in memory, then sleep and memory would be perfectly positively correlated. If every time the value of one variable increases by a fixed amount the value of the second variable decreases by a fixed amount, then the relationship between the variables is called a perfect negative correlation and r = −1 (see FIGURE 2.8b). For example, if every 30-
minute increase in sleep was associated with a 2- capital- city decrease in memory, then sleep and memory would be perfectly negatively correlated. If every time the value of one variable increases by a fixed amount the value of the second variable neither increases nor decreases systematically, then the two variables are said to be uncorrelated and r = 0 (see FIGURE 2.8c). For example, if a 30-
minute increase in sleep was sometimes associated with an increase in memory, sometimes associated with a decrease in memory, and sometimes associated with no change in memory at all, then sleep and memory would be uncorrelated.
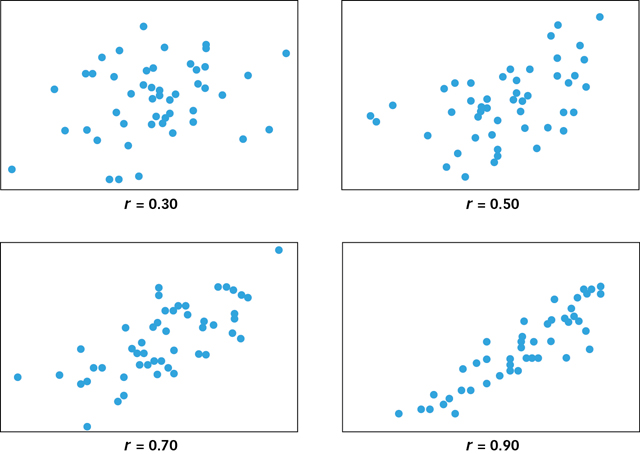
Perfect correlations are extremely rare in real life. As you will learn in the Consciousness chapter, sleep really does enhance memory performance, but the relationship is not perfect. It is not as though every 18 minutes of sleep buys you exactly one third of a remembered capital city! Sleep and memory are positively correlated (i.e., as one increases, the other also increases), but they are imperfectly correlated, thus r will lie somewhere between 0 and 1. But where? That depends on how many exceptions there are to the “X more minutes of sleep = Y more capital cities remembered” rule. If there are only a few exceptions, then r will lie much closer to 1 than to 0. But as the number of exceptions increases, then the value of r will begin to move toward 0.
54
What does it mean for a correlation to be strong?
FIGURE 2.9 shows four cases in which two variables are positively correlated but have different numbers of exceptions and, as you can see, the number of exceptions changes the value of r quite dramatically. Two variables can have a perfect correlation (r = 1 as in Figure 2.8a), a strong correlation (e.g., r = 0.90), a moderate correlation (e.g., r = 0.70), or a weak correlation (e.g., r = 0.30). The correlation coefficient, then, is a measure of both the direction and strength of the relationship between two variables. The sign of r (plus or minus) tells us the direction of the relationship and the absolute value of r (between 0 and 1) tells us about the number of exceptions and hence how confident we can be when using the correlation to make predictions.
2.3.2 Causation
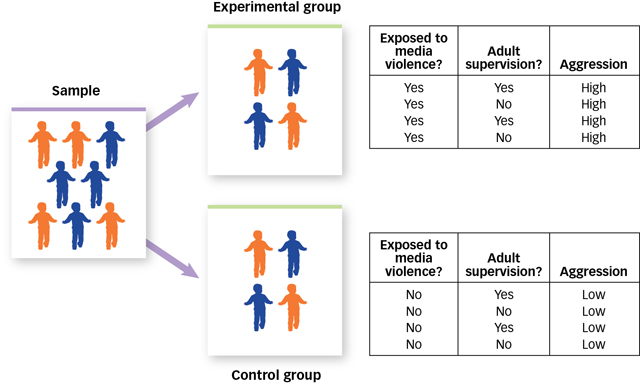
We observe correlations all the time: between automobiles and pollution, between bacon and heart attacks, between sex and pregnancy. Natural correlations are the correlations observed in the world around us, and although such observations can tell us whether two variables have a relationship, they cannot tell us what kind of relationship these variables have. For example, many studies have found a positive correlation between the amount of violence to which a child is exposed through media such as television, movies, and video games (variable X) and the aggressiveness of the child’s behaviour (variableY) (Anderson & Bushman, 2001; Anderson et al., 2003; Huesmann et al., 2003). The more media violence a child is exposed to, the more aggressive that child is likely to be. These variables clearly have a relationship—

55
2.3.2.1 The Third-Variable Problem
What is third-
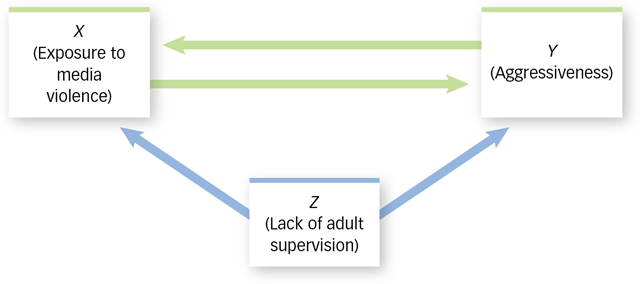
One possibility is that exposure to media violence (X) causes aggressiveness (Y). For example, media violence may teach children that aggression is a reasonable way to vent anger and solve problems. A second possibility is that aggressiveness (Y) causes children to be exposed to media violence (X). For example, children who are naturally aggressive may be especially likely to seek opportunities to play violent video games or watch violent movies. A third possibility is that a third variable (Z) causes children to be aggressive (Y) and to be exposed to media violence (X), neither of which is causally related to the other. For example, lack of adult supervision (Z) may allow children to get away with bullying others and to get away with watching television shows that adults would normally not allow. If so, then being exposed to media violence (X) and behaving aggressively (Y) may not be causally related to each other at all and may instead be the independent effects of a lack of adult supervision (Z). In other words, the relation between aggressiveness and exposure to media violence may be a case of third-
How can we determine by simple observation which of these three possibilities best describes the relationship between exposure to media violence and aggressiveness? Take a deep breath. The answer is: We cannot. When we observe a natural correlation, the possibility of third-
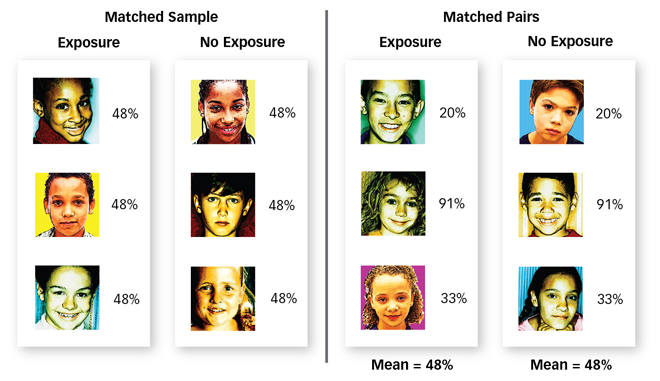
What is the difference between matched samples and matched pairs?
The most straightforward way to determine whether a third variable, such as lack of adult supervision (Z), causes both exposure to media violence (X) and aggressive behaviour (Y) is to eliminate differences in adult supervision (Z) among a group of children and see if the correlation between exposure (X) and aggressiveness (Y) is eliminated too. For example, we could observe children using the matched samples technique, which is a technique whereby the participants in two groups are identical in terms of a third variable (see FIGURE 2.11). For instance, we could measure only children who are supervised by an adult exactly Q percent of the time, thus ensuring that every child who was exposed to media violence had exactly the same amount of adult supervision as every child who was not exposed. Alternatively, we could observe children using the matched pairs technique, which is a technique whereby each participant is identical to one other participant in terms of a third variable. We could measure children who have different amounts of adult supervision, but we could make sure that for every child we measure who is exposed to media violence and is supervised Q percent of the time, we also observe a child who is not exposed to media violence and is supervised Q percent of the time, thus ensuring that children who are and are not exposed to media violence have the same amount of adult supervision on average. Regardless of which technique we used, we would know that children who were and were not exposed to media violence had equal amounts of adult supervision on average. So if those who were exposed are on average more aggressive than those who were not exposed, we can be sure that lack of adult supervision was not the cause of this difference.
56
So we solved the problem, right? Well, not exactly. The matched samples technique and the matched pairs techniques can be useful, but neither eliminates the possibility of third-
Are you starting to see the problem? There are a humongous number of third variables, so there are a humongous number of reasons why X and Y might be correlated. And because we cannot perform a humongous number of studies with matched samples or matched pairs, we cannot be absolutely sure that the correlation we observe between X and Y is evidence of a causal relationship between them. The third-
57
2.3.2.2 Experimentation
The matched pairs and matched samples techniques eliminate a single difference between two groups: for example, the difference in adult supervision between groups of children who were and were not exposed to media violence. The problem is that they only eliminate one difference and a humongous number remain. If we could just find a technique that eliminated all of the humongous number of differences then we could conclude that exposure and aggression are causally related. If exposed kids were more aggressive than unexposed kids, and if the two groups did not differ in any way except for that exposure, then we could be sure that their level of exposure had caused their level of aggression.
What are the two main features of an experiment?
In fact, scientists have a technique that does exactly that. It is called an experiment, which is a technique for establishing the causal relationship between variables. The best way to understand how experiments eliminate all the differences between groups is by examining their two key features: manipulation and random assignment.
2.3.2.3 Manipulation
The most important thing to know about experiments is that you already know the most important thing about experiments because you have been doing them all your life. Imagine that you are surfing the web on a laptop when all of a sudden you lose your wireless connection. You suspect that another device—

So how could you test your suspicion? Well, rather than observing the correlation between cell phone usage and connectivity, you could try to create a correlation by intentionally making a call on your roommate’s cell phone, hanging up, making another call, hanging up again, and observing changes in your laptop’s connectivity as you did so. If you observed that “laptop connection off” only occurred in conjunction with “cell phone on” then you could conclude that your roommate’s cell phone was the cause of your failed connection, and you could sell the phone on eBay and then lie about it when asked. The technique you intuitively used to solve the third-
58
Manipulation is a critical ingredient in experimentation. Until now, we have approached science like polite dinner guests, taking what we were offered and making the best of it. Nature offered us children who differed in how much violence they were exposed to and who differed in how aggressively they behaved, and we dutifully measured the natural patterns of variation in these two variables and computed their correlations. The problem with this approach is that when all was said and done, we still did not know what we really wanted to know, namely, whether these variables had a causal relationship. No matter how many matched samples or matched pairs we observed, there was always another third variable that we had not yet dismissed. Experiments solve this problem. Rather than measuring exposure and measuring aggression and then computing the correlation between these two naturally occurring variables, experiments require that we manipulate exposure in exactly the same way that you manipulated your roommate’s cell phone. In essence, we need to systematically switch exposure on and off in a group of children and then watch to see whether aggression goes on and off too.
There are many ways to do this. For example, we might ask some children to participate in an experiment, then have half of them play violent video games for an hour and make sure the other half does not. Then, at the end of the hour, we could measure the children’s aggression and compare the measurements across the two groups. When we compared these measurements, we would essentially be computing the correlation between a variable that we manipulated (exposure) and a variable that we measured (aggression). Because we manipulated rather than measured exposure, we would never have to ask whether a third variable (such as lack of adult supervision) caused children to experience different levels of exposure. After all, we already know what caused that to happen. We did!
Experimentation involves three critical steps (and several ridiculously confusing terms):
What are the three main steps in doing an experiment?
First, we perform a manipulation. We call the variable that is manipulated the independent variable because it is under our control, and thus it is “independent” of what the participant says or does. When we manipulate an independent variable (such as exposure to media violence), we create at least two groups of participants: an experimental group, which is the group of people who are exposed to a particular manipulation, and a control group, which is the group of people who are not exposed to that particular manipulation. (Another way to design an experiment would be to test every participant in the experiment twice—
once when they have experienced the manipulation and once when they have not. Such a design is efficient, but it is not possible for every experimental question.) Second, having manipulated one variable (exposure), we now measure another variable (aggression). We call the variable that is measured the dependent variable because its value “depends” on what the person being measured says or does.
Third and finally, we look to see whether our manipulation of the independent variable produced changes in the dependent variable. FIGURE 2.12 shows exactly how manipulation works.
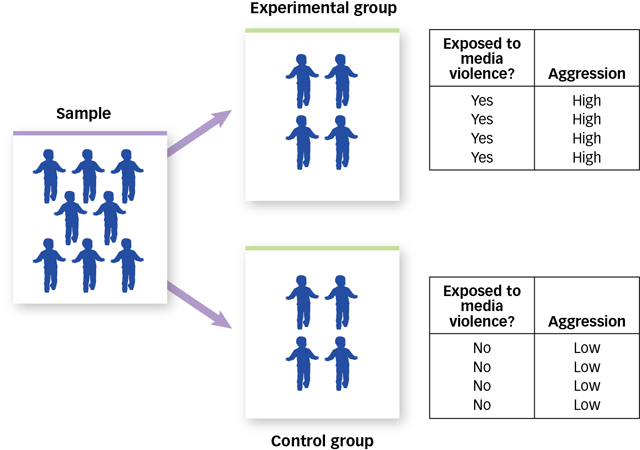 Figure 2.12: Manipulation The independent variable is exposure to media violence and the dependent variable is aggression. Manipulation of the independent variable results in an experimental group and a control group. When we compare the behaviour of participants in these two groups, we are actually computing the correlation between the independent variable and the dependent variable.
59
2.3.2.4 Random Assignment
Once we have manipulated an independent variable and measured a dependent variable, we have done one of the two things that experimentation requires. The second thing is a little less intuitive but equally important. Imagine that we began our exposure and aggression experiment by finding a group of children and asking each child whether he or she would like to be in the experimental group or the control group. Imagine that half the children said that they would like to play violent video games and the other half said they would rather not. Imagine that we let the children do what they wanted to do, measured aggression some time later, and found that the children who had played the violent video games were more aggressive than those who had not. Would this experiment allow us to conclude that playing violent video games causes aggression? Definitely not—

Why can we not allow people to select the condition of the experiment in which they will participate?
We went wrong when we let the children decide for themselves whether or not they would play violent video games. After all, children who ask to play such games are probably different in many ways from those who ask not to. They may be older, or stronger, or smarter—
60
Why is random assignment so useful and important?
The answer to this question is a bit spooky: No one does. If we want to be sure that there is one and only one difference between the children in our study who are and are not exposed to media violence, then their inclusion in the experimental or control groups must be randomly determined. If you flipped a coin and a friend asked what had caused it to land heads up, you would correctly say that nothing had. This is what it means for the outcome of a coin flip to be random. Because the outcome of a coin flip is random, we can put coin flips to work for us to solve the problem that self-

What would happen if we assigned children to groups with a coin flip? As FIGURE 2.13 shows, the first thing we would expect is that about half the children would be assigned to play violent video games and about half would not. Second—
61
2.3.2.5 Significance
Random assignment is a powerful tool but, like a lot of tools, it does not work every time you use it. If we randomly assigned children to watch or not watch televised violence, we could expect the two groups to have roughly equal numbers of supervised and unsupervised kids, roughly equal numbers of emotionally stable and unstable kids, and so on. The key word in that sentence is roughly. When you flip a coin 100 times, you can expect it to land heads up roughly 50 times. But every once in a while, 100 coin flips will produce 80 heads, or 90 heads, or even 100 heads, by sheer chance alone. This does not happen often, of course, but it does happen. Because random assignment is achieved by using a randomizing device such as a coin, every once in a long while the coin will assign more unsupervised, emotionally unstable kids to play violent video games and more supervised, emotionally stable kids to play none. When this happens, random assignment has failed—
THE REAL WORLD: “Oddsly” Enough
A recent Gallup survey found that 53 percent of university graduates believe in extrasensory perception, or ESP. Very few psychologists share that belief. What makes them such a skeptical lot is their understanding of the laws of probability.
Consider the case of The Truly Amazing Coincidence. One night you dream that a panda is piloting an airplane over the Indian Ocean, and the next day you tell a friend, who says, “Wow, I had exactly the same dream!” One morning you wake up humming an old Radiohead tune (probably “Paranoid Android”) and an hour later you hear it playing in the mall. You and your roommate are sitting around watching television when suddenly you turn to each other and say in perfect unison, “Want pizza?” Coincidences like these might make anyone believe in supernatural mental weirdness.
Well, not anyone. The Nobel laureate Luis Alvarez was reading the newspaper one day and a particular story got him thinking about an old friend whom he had not seen in years. A few minutes later, he turned the page and was shocked to see the very same friend’s obituary. But before concluding that he had an acute case of ESP Alvarez decided to use probability theory to determine just how amazing this coincidence really was.
First he estimated the number of friends an average person has, and then he estimated how often an average person thinks about each of those friends. With these estimates in hand, he did a few simple calculations and determined the likelihood that someone would think about a friend 5 minutes before learning about that friend’s death. The odds were astonishing. In a country the size of the United States, for example, Alvarez predicted that this amazing coincidence should happen to 10 people every day (Alvarez, 1965). Another Nobel laureate disagreed. He put the number closer to 80 people a day (Charpak & Broch, 2004)!
“In 10 years there are 5 million minutes,” says statistics professor Irving Jack. “That means each person has plenty of opportunity to have some remarkable coincidences in his life” (quoted in Neimark, 2004). For example, 28 million Canadians dream for about two hours every night (that is 56 million hours of dreaming!), so it is not surprising that two people sometimes have the same dream, or that we sometimes dream about something that actually happens the next day. As mathematics professor John Allen Paulos (quoted in Neimark, 2004) put it, “In reality, the most astonishingly incredible coincidence imaginable would be the complete absence of all coincidence.”
If all of this seems surprising to you, then you are not alone. Research shows that people routinely underestimate the likelihood of coincidences happening by chance (Diaconis & Mosteller, 1989; Falk & McGregor, 1983; Hintzman, Asher, & Stern, 1978). If you want to profit from this fact, assemble a group of 24 or more people and bet anyone that at least 2 of the people share a birthday. The odds are in your favour, and the bigger the group, the better the odds. In fact, in a group of 35, the odds are 85 percent. Happy fleecing!
62
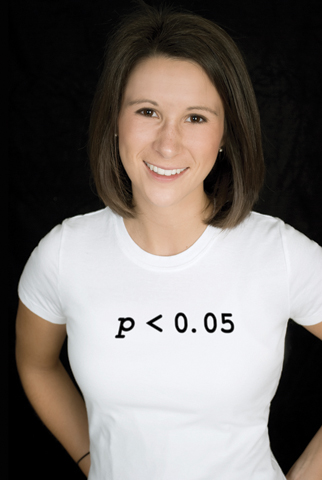
How can we tell when random assignment has failed? Unfortunately, we cannot tell for sure. But we can calculate the odds that random assignment has failed each time we use it. It is not important for you to know how to do this calculation, but it is important for you to understand how psychologists interpret its results. Psychologists perform this calculation every time they do an experiment, and they do not accept the results of those experiments unless the calculation tells them that if random assignment had failed, then there is less than a 5 percent chance that they would have seen those particular results.
When there is less than a 5 percent chance that a result would happen if random assignment had failed, then that result is said to be statistically significant. You have already learned about descriptive statistics, such as mean, median, mode, range, and standard deviation. There is another kind of statistics—
2.3.3 Drawing Conclusions
If we applied all the techniques discussed so far, we could design an experiment that had a very good chance of establishing the causal relationship between two variables. That experiment would have internal validity, which is an attribute of an experiment that allows it to establish causal relationships. When we say that an experiment is internally valid, we mean that everything inside the experiment is working exactly as it must in order for us to draw conclusions about causal relationships. But what exactly are those conclusions? If our imaginary experiment revealed a difference between the aggressiveness of children in the exposed and unexposed groups, then we could conclude that media violence as we defined it caused aggression as we defined it in the people whom we studied. Notice those phrases in italics. Each corresponds to an important restriction on the kinds of conclusions we can draw from an experiment, so let us consider each in turn.
2.3.3.1 Representative Variables
The results of any experiment depend, in part, on how the independent and dependent variables are defined. For instance, we are more likely to find that exposure to media violence causes aggression when we define exposure as “watching 2 hours of gory axe murders” rather than “watching 10 minutes of football,” or when we define aggression as “interrupting another person” rather than “smacking someone silly with a tire iron.” The way we define variables can have a profound influence on what we find, so which of these is the right way?

One answer is that we should define variables in an experiment as they are defined in the real world. External validity is an attribute of an experiment in which variables have been defined in a normal, typical, or realistic way. It seems pretty clear that the kind of aggressive behaviour that concerns teachers and parents lies somewhere between an interruption and an assault, and that the kind of media violence to which children are typically exposed lies somewhere between sports and torture. If the goal of an experiment is to determine whether the kinds of media violence to which children are typically exposed causes the kinds of aggression with which societies are typically concerned, then external validity is essential. When variables are defined in an experiment as they typically are in the real world, we say that the variables are representative of the real world.
63
Why is external validity unnecessary?
External validity sounds like such a good idea that you may be surprised to learn that most psychology experiments are externally invalid—
To see how, consider an example from physics. Physicists have a theory stating that heat is the result of the rapid movement of molecules. This theory gives rise to a hypothesis, namely, that when the molecules that constitute an object are slowed, the object should become cooler. Now imagine that a physicist tested this hypothesis by performing an experiment in which a laser was used to slow the movement of the molecules in a rubber ball, whose temperature was then measured. Would you criticize this experiment by saying, “Sorry, but your experiment teaches us nothing about the real world because in the real world, no one actually uses lasers to slow the movement of the molecules in rubber balls”? Let us hope not. The physicist’s theory (molecular motion causes heat) led to a hypothesis about what would happen in the laboratory (slowing the molecules in a rubber ball should cool it), and the events that the physicist manipulated and measured in the laboratory served to test the theory. Similarly, a well-
In short, theories allow us to generate hypotheses about what can, must, or will happen under particular circumstances, and experiments are usually meant to create those circumstances, test the hypotheses, and thereby provide evidence for or against the theories that generated them. Experiments are not usually meant to be miniature versions of everyday life, and thus external invalidity is not necessarily a problem (see the Hot Science box, Do Violent Movies Make Peaceful Streets?).
2.3.3.2 Representative People
Our imaginary experiment on exposure to media violence and aggression would allow us to conclude that exposure as we defined it caused aggression as we defined it in the people whom we studied. That last phrase represents another important restriction on the kinds of conclusions we can draw from experiments.
64
HOT SCIENCE: Do Violent Movies Make Peaceful Streets?

In 2000, the American Academy of Pediatrics and five other American public health organizations issued a joint statement warning about the risks of exposure to media violence. They cited evidence from psychological experiments in which children and young adults who were exposed to violent movie clips showed a sharp increase in aggressive behaviour immediately afterward. They noted that “well over 1000 studies … point overwhelmingly to a causal connection between media violence and aggressive behaviour.”
Given the laboratory results, we might expect to see a correlation in the real world between the number of people who see violent movies in theatres and the number of violent crimes. When economists Gordon Dahl and Stefano Della Vigna (2009) analyzed crime statistics and box office statistics, they found just such a correlation—
Laboratory experiments clearly show that exposure to media violence can cause aggression. But as the movie theatre data remind us, experiments are a tool for establishing the causal relationships between variables and are not meant to be miniature versions of the real world, where things are ever so much more complex.
What is the difference between a population and a sample?
Who are the people whom psychologists study? Psychologists rarely observe an entire population, which is a complete collection of people, such as the population of human beings (about 7 billion), the population of Canadians (about 35 million), or the population of Canadians with Down syndrome (about 35 000). Rather, they observe a sample, which is a partial collection of people drawn from a population. How big can a sample be? The size of a population is signified by the uppercase letter N, the size of a sample is signified by the lowercase letter n, so 0 < n < N. If you read this as an emoticon it means … oh well, never mind.
In most studies n is closer to 0 than to N, and in some cases n = 1. For example, sometimes single individuals are so remarkable that they deserve close study, and when psychologists study them they use the case method, which is a procedure for gathering scientific information by studying a single individual. We can learn a lot about memory by studying someone like Akira Haraguchi, who can recite the first 100 000 digits of pi; about consciousness by studying someone like Henry Molaison, whose ability to look backward and forward in time was destroyed by damage to his brain; about intelligence and creativity by studying someone like former child prodigy Jay Greenburg, whose musical compositions have been recorded by the Julliard String Quartet and the London Symphony Orchestra. Cases such as these are interesting in their own right, but they also provide important insights into how the rest of us work.

Of course, most of the psychological studies you will read about in the other chapters of this book included samples of ten, a hundred, a thousand, or a few thousand people. So how do psychologists decide which people to include in their samples? One way to select a sample from a population is by random sampling, which is a technique for choosing participants that ensures that every member of a population has an equal chance of being included in the sample. When we randomly sample participants from a population, the sample is said to be representative of the population. This allows us to generalize from the sample to the population—
65
If random sampling is good, why is it not necessary?
Random sampling sounds like such a good idea that you might be surprised to learn that most psychological studies involve nonrandom samples—
So why do psychologists sample nonrandomly? They have no choice. Even if there were a computerized list of all the world’s human inhabitants from which we could randomly choose our research participants, how would we ever find the 72-
So how can we learn anything from psychology experiments? Surely the failure to sample randomly is a fatal flaw? No, it is not, and there are three reasons why. First, sometimes the similarity of a sample and a population does not matter. If one pig flew over the CN Tower just one time, it would instantly disprove the traditional theory of porcine locomotion. It would not matter if all pigs flew or if any other pigs flew. If one did, then that is enough. An experimental result can be illuminating even when the sample is not typical of the population.
Why is nonrandom sampling a nonfatal flaw?
Second, when the ability to generalize an experimental result is important, psychologists perform new experiments that use the same procedures but on different samples. For example, after measuring how a nonrandomly selected group of Canadian children behaved after playing violent video games, we might try to replicate our experiment with Japanese children, or with Canadian teenagers, or with deaf adults. In essence, we could treat the attributes of our sample, such as culture and age and ability, as independent variables, and we could do experiments to determine whether these attributes influenced our dependent variable. If the results of our study were replicated in these other samples, then we would be more confident (but never completely confident) that the results describe a basic human tendency. If the results do not replicate, then we would learn something about the influence of culture or age or ability on aggressiveness. Replicating research with new samples drawn from different populations is a win–
Third, sometimes the similarity of the sample and the population is simply a reasonable starting assumption. Instead of asking, “Do I have a compelling reason to believe that my sample is representative of the population?” we could instead ask, “Do I have a compelling reason not to?” For example, few of us would be willing to take an experimental medicine if a nonrandom sample of seven participants took it and died. Indeed, we would probably refuse the medicine even if the seven participants were mice. Although these nonrandomly sampled participants were different from us in many ways (including tails and whiskers), most of us would be willing to generalize from their experience to ours because we know that even mice share enough of our basic biology to make it a good bet that what harms them can harm us too. By this same reasoning, if a psychology experiment demonstrated that some Canadian children behaved violently after playing violent video games, we might ask whether there is a compelling reason to suspect that Ecuadorian University students or middle-
66
2.3.4 Thinking Critically about Evidence

In 1620, Sir Francis Bacon published a book called Novum Organum in which he described a new method for discovering the truth about the natural world. Today, his so-
As you have seen in this chapter, the scientific method allows us to produce empirical evidence. But empirical evidence is only useful if we know how to think about it, and the fact is that most of us do not. Using evidence requires critical thinking, which involves asking ourselves tough questions about whether we have interpreted the evidence in an unbiased way, and whether the evidence tells not just the truth, but the whole truth. Research suggests that most people have trouble doing both of these things, and that educational programs designed to teach or improve critical thinking skills are not particularly effective (Willingham, 2007). Why do people have so much trouble thinking critically?

Consider the armadillo. Some animals freeze when threatened, and others duck, run, or growl. Armadillos jump. This natural tendency served armadillos quite well for millennia because for millennia the most common threat to an armadillo’s well-
Human beings also have natural tendencies that once served them well but no longer do. Our natural and intuitive ways of thinking about evidence, for example, worked just fine when we were all hunter-
2.3.4.1 We See What We Expect and Want
When two people are presented with the same evidence, they often draw different conclusions. Sir Francis Bacon knew why. “The human understanding, once it has adopted opinions… draws everything else to support and agree with them,” thus our “first conclusion colours and brings into conformity with itself all that come after.” In other words, our pre-
This tendency has been widely documented in psychological science. For instance, participants in one study (Darley & Gross, 1983) learned about a little girl named Hannah. One group of participants was told that Hannah came from an affluent family and another group was told that Hannah came from a poor family. All participants were then shown some evidence about Hannah’s academic abilities (specifically, they watched a video of Hannah taking a reading test) and were then asked to rate Hannah. Although the video was exactly the same for all participants, those who believed that Hannah was affluent rated her performance more positively than did those who believed that Hannah was poor. What is more, both groups of participants defended their conclusions by citing evidence from the video! Experiments like this one suggest that when we consider evidence, what we see depends on what we expected to see.
67
Our beliefs are not the only things that colour our views of evidence. Those views are also coloured by our preferences and prejudices, our ambitions and aversions, our hopes and needs and wants and dreams. As Bacon noted, “The human understanding is not a dry light, but is infused by desire and emotion which give rise to wishful science. For man prefers to believe what he wants to be true.”
Research suggests that Bacon was right about this as well. For example, participants in one study (Lord, Ross, & Lepper, 1979) were shown some scientific evidence about the effectiveness of the death penalty. Some of the evidence suggested that the death penalty deterred crime, and some suggested it did not. What did participants make of this mixed bag of evidence? Participants who originally supported the death penalty became even more supportive, and participants who originally opposed the death penalty became even more opposed. In other words, when presented with exactly the same evidence, participants saw what they wanted to see and ended up feeling even more sure about their initial views. Subsequent research has shown that the same pattern emerges when professional scientists are asked to rate the quality of scientific studies that either confirm or disconfirm what they want to believe (Koehler, 1993).
How do our beliefs and desires shape the way we think about evidence?
Exactly how do beliefs and desires shape our view of the evidence? People hold different kinds of evidence to different standards. When evidence confirms what we believe or want to believe, we tend to ask ourselves, “Can I believe it?” and our answer is usually yes; but when evidence disconfirms what we believe or want to believe, we tend to ask ourselves, “Must I believe it?” and the answer is often no (Gilovich, 1991). Can you believe that people with university degrees are happier than people without them? Yes! There are plenty of surveys showing that just such a relationship exists and a reasonable person who studied the evidence could easily defend this conclusion. Now, must you believe it? Well, no. After all, those surveys did not measure every single person on Earth, did they? And if the survey questions had been asked differently they might well have produced different answers, right? A reasonable person who studied the evidence could easily conclude that the relationship between education and happiness is not yet clear enough to warrant an opinion.
Our beliefs and desires also influence which evidence we consider in the first place. Most people surround themselves with others who believe what they believe and want what they want, which means that our friends and families are much more likely to validate our beliefs and desires than to challenge them. Studies also show that when given the opportunity to search for evidence, people preferentially search for evidence that confirms their beliefs and fulfills their desires (Hart et al., 2009). What is more, when people find evidence that confirms their beliefs and fulfills their desires, they tend to stop looking, but when they find evidence that does the opposite, they keep searching for more evidence (Kunda, 1990).
What all of these studies suggest is that evidence leaves room for interpretation, and that is the room in which our beliefs and desires spend most of their time. Because it is so easy to see what we expect to see or to see what we want to see, the first step in critical thinking is simply to doubt your own conclusions. One of the best ways to reduce your own certainty is to seek out people who doubt you and listen carefully to what they have to say. Scientists go out of their way to expose themselves to criticism by sending their papers to the colleagues who are most likely to disagree with them or by presenting their findings to audiences full of critics, and they do this in large part so they can achieve a more balanced view of their own conclusions. If you want to be happy, take your friend to lunch; if you want to be right, take your enemy.
68
2.3.4.2 We Consider What We See and Ignore What We Do not
In another part of his remarkable book, Sir Francis Bacon recounted an old story about a man who visited a Roman temple. The priest showed the man a portrait of several sailors who had taken religious vows and then miraculously survived a shipwreck, and suggested that this was clear evidence of the power of the gods. The visitor paused a moment and then asked precisely the right question: “But where are the pictures of those who perished after taking their vows?” According to Bacon, most of us never think to ask this kind of question. We consider the evidence we can see and forget about the evidence we cannot. Bacon claimed that “little or no attention is paid to things invisible” and he argued that this natural tendency was “the greatest impediment and aberration of the human understanding.”
Bacon was right when he claimed that people rarely consider what they cannot see. For example, participants in one study (Newman, Wolff, & Hearst, 1980) played a game in which they were shown a set of trigrams, which are three-
The tendency to ignore missing evidence can cause us to draw all kinds of erroneous conclusions. Consider a study in which participants were randomly assigned to play one of two roles in a game (Ross, Amabile, & Steinmetz, 1977). The “quizmasters” were asked to make up a series of difficult questions, and the “contestants” were asked to answer them. If you give this a quick try, you will discover that it is very easy to generate questions that you can answer but that most other people cannot. For example, think of the last city you visited. Now give someone the name of the hotel you stayed in and ask them what street it is on. Very few will know.
Why is it important to consider unseen evidence?
So participants who were cast in the role of quizmaster asked lots of clever-
69
2.3.4.3 The Skeptical Stance
Winston Churchill once said that democracy is the worst form of government, except for all the others. Similarly, science is not an infallible method for learning about the world; it is just a whole lot less fallible than the other methods. Science is a human enterprise, and humans make mistakes. They see what they expect to see, they see what they want to see, and they rarely consider what they cannot see at all.
What makes science different than most other human enterprises is that science actively seeks to discover and remedy its own biases and errors. Scientists are constantly striving to make their observations more accurate and their reasoning more rigorous, and they invite anyone and everyone to examine their evidence and challenge their conclusions. As such, science is the ultimate democracy—
So think of the remaining chapters in this book as a report from the field—
To determine whether two variables are causally related, we must first determine whether they are related at all. This can be done by measuring each variable many times and then comparing the patterns of variation within each series of measurements. If the patterns covary, then the variables are correlated. Correlations allow us to predict the value of one variable from knowledge of the value of the other. The direction and strength of a correlation are measured by the correlation coefficient (r).
Even when we observe a correlation between two variables, we cannot conclude that they are causally related because there are an infinite number of third variables that might be causing them both. Experiments solve this third-
variable problem by manipulating an independent variable, randomly assigning participants to the experimental and control groups that this manipulation creates, and measuring a dependent variable. These measurements are then compared across groups. If inferential statistics show that there was less than a 5 percent chance that random assignment failed, then differences in the measurements across groups are assumed to have been caused by the manipulation. An internally valid experiment establishes a causal relationship between variables as they were operationally defined and among the participants whom they included. When an experiment mimics the real world, it is externally valid. Most psychology experiments are not attempts to mimic the real world, but to test hypotheses derived from theories.
Thinking critically about evidence is difficult because people have a natural tendency to see what they expect to see, to see what they want to see, and to consider what they see but not what they do not.
70