16.3 Measuring Correlation
Most of us have learned from experience that memory works better when we’ve had a good night’s sleep. So if you were to predict that well-
correlation coefficient
A mathematical measure of both the direction and strength of a correlation, which is symbolized by the letter r.
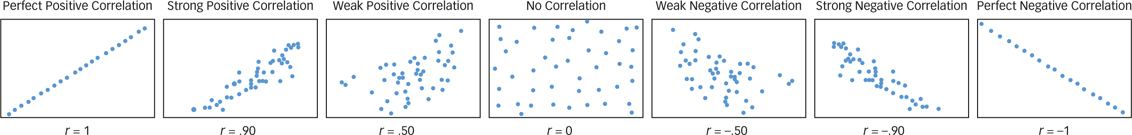
- If every time the value of one variable increases by a fixed amount the value of the second variable also increases by a fixed amount, then the relationship between the variables is called a perfect positive correlation and r = 1 (see FIGURE A.6). For example, if every 30-
minute increase in sleep were associated with a 10% increase in memory, then sleep and memory would be perfectly positively correlated. - If every time the value of one variable increases by a fixed amount the value of the second variable decreases by a fixed amount, then the relationship between the variables is called a perfect negative correlation and r = −1 (see FIGURE A.6). For example, if every 30-
minute increase in sleep were associated with a 10% decrease in memory, then sleep and memory would be perfectly negatively correlated. - If every time the value of one variable increases by a fixed amount the value of the second variable neither increases nor decreases systematically, then the two variables are said to be uncorrelated and r = 0 (see FIGURE A.6). For example, if a 30-
minute increase in sleep were sometimes associated with an increase in memory, sometimes associated with a decrease in memory, and sometimes associated with no change in memory at all, then sleep and memory would be uncorrelated.
Perfect correlations are extremely rare. In the real world, sleep and memory performance are positively correlated (i.e., as one increases, the other usually increases), but they are imperfectly correlated (i.e., every 1-
A-