9.3 Decision Making: Rational and Otherwise
We use categories and concepts to guide the hundreds of decisions and judgments we make during the course of an average day. Some decisions are easy (what to wear, what to eat for breakfast, and whether to walk or drive to class) and some are more difficult (which car to buy, which apartment to rent, and even which job to take after graduation). Some decisions are made based on sound judgments. Others are not.
The Rational Ideal
Economists contend that if we are rational and are free to make our own decisions, we will behave as predicted by rational choice theory: the classical view that we make decisions by determining how likely something is to happen, judging the value of the outcome, and then multiplying the two (Edwards, 1955). This means that our judgments will vary depending on the value we assign to the possible outcomes. Suppose, for example, you were asked to choose between a 10% chance of gaining $500 and a 20% chance of gaining $2,000. The rational person would choose the second alternative because the expected payoff is $400 ($2,000 × 20%), whereas the first offers an expected gain of only $50 ($500 × 10%). Selecting the option with the highest expected value seems very straightforward. But how well does this theory describe decision making in our everyday lives? In many cases, the answer is not very well.
rational choice theory
The classical view that we make decisions by determining how likely something is to happen, judging the value of the outcome, and then multiplying the two.
The Irrational Reality
Is the ability to classify new events and objects into categories always a useful skill? Alas, no. The same principles that allow cognition to occur easily and accurately can pop up to bedevil our decision making.
Judging Frequencies and Probabilities
Consider the following list of words:
block table block pen telephone block disk glass table block telephone block watch table candy
You probably noticed that the words block and table occurred more frequently than the other words did. In fact, studies have shown that people are quite good at estimating frequency, or the number of times something will happen. In contrast, we perform poorly on tasks that require us to think in terms of probabilities, or the likelihood that something will happen.
289
In one experiment, 100 physicians were asked to predict the incidence of breast cancer among women whose mammograms showed possible evidence of breast cancer. The physicians were told to take into consideration the rarity of breast cancer (1% of the population at the time the study was done) and radiologists’ record in diagnosing the condition (correctly recognized only 79% of the time and falsely diagnosed almost 10% of the time). Of the 100 physicians, 95 estimated the probability of cancer at about 75%! The correct answer was 8% (Eddy, 1982). But dramatically different results were obtained when the study was repeated using frequency information instead of probability information. Stating the problem as “10 out of every 1,000 women actually have breast cancer” instead of “1% of women actually have breast cancer” led 46% of the physicians to derive the right answer (Hoffrage & Gigerenzer, 1998).
Why is a better decision more likely when considering frequency, versus probability, that something will happen?
The frequency format hypothesis is the proposal that our minds evolved to notice how frequently things occur, not how likely they are to occur (Gigerenzer, 1996; Gigerenzer & Hoffrage, 1995). Thus, we interpret, process, and manipulate information about frequency with comparative ease because that’s the way quantitative information usually occurs in natural circumstances. For example, the 20 men, 15 women, 5 dogs, 13 cars, and 2 bicycle accidents you encountered on the way to class came in the form of frequencies, not probabilities or percentages. Therefore, the frequency format provides an explanation for why physicians do so much better at predicting incidence of breast cancer when the relevant information is presented as frequencies rather than as probabilities.
frequency format hypothesis
The proposal that our minds evolved to notice how frequently things occur, not how likely they are to occur.
Availability Bias
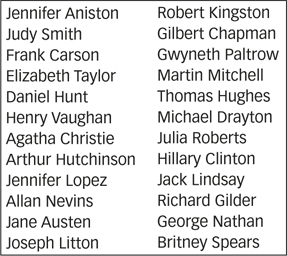
Take a look at the list of names in FIGURE 9.8. Now look away from the book and estimate the number of male names and female names in the figure. Did you notice that some of the women on the list are famous and none of the men are? Was your estimate off because you thought the list contained more women’s than men’s names (Tversky & Kahneman, 1973, 1974)? People typically fall prey to availability bias: Items that are more readily available in memory are judged as having occurred more frequently.
availability bias
Items that are more readily available in memory are judged as having occurred more frequently.
How are memory strength and frequency of occurrence related?
The availability bias affects our estimates because memory strength and frequency of occurrence are directly related. Frequently occurring items are remembered more easily than infrequently occurring items, so you naturally conclude that items for which you have better memory must also have been more frequent. Unfortunately, better memory in this case was not due to greater frequency, but to greater familiarity.
The Conjunction Fallacy
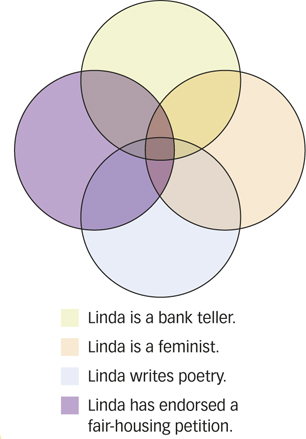
Consider the following description:
Linda is 31 years old, single, outspoken, and very bright. In college, she majored in philosophy. As a student, she was deeply concerned with issues of discrimination and social justice and also participated in antinuclear demonstrations.
Which state of affairs is more probable?
a. Linda is a bank teller.
b. Linda is a bank teller and is active in the feminist movement.
290
In one study, 89% of participants rated option b as more probable than option a (Tversky & Kahneman, 1983).
How can more information sometimes lead people to wrong conclusions?
This is called the conjunction fallacy, which is when people think that two events are more likely to occur together than either individual event. Actually, the reverse is true: The probability of two or more events occurring simultaneously (in conjunction) is always less than the probability of each event occurring alone, as you can see in FIGURE 9.9.
conjunction fallacy
When people think that two events are more likely to occur together than either individual event.
Representativeness Heuristic
Think about the following situation:
A panel of psychologists wrote descriptions of 100 people, including 70 engineers and 30 lawyers. You will be shown a random selection of these descriptions. Read each and decide if it is more likely that the person is an engineer or a lawyer.
- Jack enjoys reading books on social and political issues. During the interview, he displayed particular skill at argument.
- Tom is a loner who enjoys working on mathematical puzzles during his spare time. During the interview, his speech remained fairly abstract, and his emotions were well controlled.
- Harry is a bright man and an avid racquetball player. During the interview, he asked many insightful questions and was very well spoken.
What can cause people to ignore the base rate of an event?
The majority of research participants thought that Jack was more likely to be a lawyer and that Tom was more likely to be an engineer. Harry’s description doesn’t sound like a lawyer’s or an engineer’s, so most people said he was equally likely to hold either occupation (Kahneman & Tversky, 1973). But remember that the pool of descriptions contains more than twice as many engineers as lawyers, so based on this proportion, it is far more likely that Harry is an engineer. People seem to ignore information about base rate, or the probability of an event, and instead base their judgments on similarities to categories. Researchers call this the representativeness heuristic, a mental shortcut that involves making a probability judgment by comparing an object or event to a prototype of the object or event (Kahneman & Tversky, 1973).
representativeness heuristic
A mental shortcut that involves making a probability judgment by comparing an object or event to a prototype of the object or event.
Framing Effects
If people are told that a particular drug has a 70% effectiveness rate, they’re usually pretty impressed. Tell them instead that a drug has a 30% failure rate and they typically perceive it as risky and potentially harmful. Notice that the information is the same: A 70% effectiveness rate means that 30% of the time, it’s ineffective. The way the information is presented, however, leads to substantially different conclusions (Tversky & Kahneman, 1981). This is called the framing effect, which occurs when people give different answers to the same problem depending on how the problem is phrased (or framed).
framing effects
When people give different answers to the same problem depending on how the problem is phrased (or framed).
Is a 70% success rate better than a 30% failure rate?
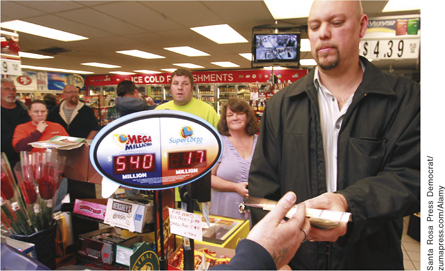
One of the most striking framing effects is the sunk-cost fallacy, a framing effect in which people make decisions about a current situation based on what they have previously invested in the situation. Imagine waiting in line for 3 hours, paying $100 for a ticket to the Warped Tour to see your favorite bands, and waking on the day of the outdoor concert to find that it’s bitterly cold and rainy. If you go, you’ll feel miserable. But you go anyway, reasoning that the $100 you paid for the ticket and the time you spent in line will have been wasted if you stay home.
sunk-cost fallacy
A framing effect in which people make decisions about a current situation based on what they have previously invested in the situation.
291
Notice that you have two choices: (1) Stay comfortably at home or (2) endure many uncomfortable hours in the rain. The $100 is gone in either case: It’s a sunk cost. But because you invested time and money, you feel obligated to follow through, even though it’s something you no longer want.
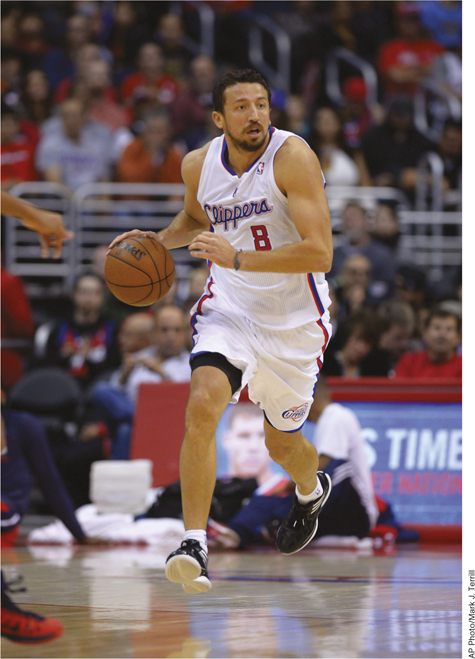
Even the National Basketball Association (NBA) is guilty of a sunk-
Another kind of framing effect occurs when information is presented in terms of losses instead of in terms of savings. For example, imagine you’re renting a new apartment, and, as part of a promotion, you’re given a choice between a $300 rebate on your first month’s rent or spinning a wheel that offers an 80% chance of getting a $400 rebate. Which would you choose? If you’re like most people, you’ll choose the sure $300 over the risky $400.
But suppose the lease offers you a choice of penalty for damaging the apartment: either $300, or spin a wheel that offers an 80% chance of a $400 fine. Now which would you choose? Most people will choose to gamble by spinning the wheel, taking the chance of avoiding the fine altogether, even though the odds are they’ll wind up paying more than the sure $300.
Prospect theory states that people choose to take on risk when evaluating potential losses and avoid risks when evaluating potential gains (Tversky & Kahneman, 1992). This asymmetry in risk preferences shows that we are willing to take on risk if we think it will ward off a loss, but we’re risk-
prospect theory
People choose to take on risk when evaluating potential losses and avoid risks when evaluating potential gains.
Culture & Community: Does culture influence optimism bias?
Does culture influence optimism bias? In addition to the biases described in this chapter, human decision making often reflects the effects of optimism bias: People believe that they are more likely to experience positive events and less likely to experience negative events in the future, compared with other people (Sharot, 2011; Weinstein, 1980). Several studies have found that optimism bias is greater in North Americans than in individuals from Eastern cultures such as Japan (Heine & Lehman, 1995; Klein & Helweg-
Findings such as these may ultimately be helpful in attempting to understand why the optimism bias occurs. Although many possibilities have been suggested (Sharot, 2011), researchers haven’t yet come up with a theory that explains all of the relevant evidence. Focusing on cultural similarities and differences in optimism bias may help to achieve that goal, although we shouldn’t be unrealistically optimistic that we will achieve it anytime soon!
292
Decision Making and the Brain
A man identified as Elliot (whom you met briefly in the Psychology: Evolution of a Science chapter) was a successful businessman, husband, and father prior to developing a brain tumor. After surgery, his intellectual abilities seemed intact, but he was unable to differentiate between important and unimportant activities. He lost his job and got involved in several risky financial ventures that bankrupted him. He had no difficulty discussing what had happened, but his descriptions were so detached and dispassionate that it seemed as though his abstract intellectual functions had become dissociated from his social and emotional abilities.
Research confirms that this interpretation of Elliot’s downfall is right on track. In one study, researchers looked at how healthy volunteers differed from people with prefrontal lobe damage on a gambling task that involves risky decision making (Bechara et al., 1994, 1997). Participants were allowed to choose cards one-
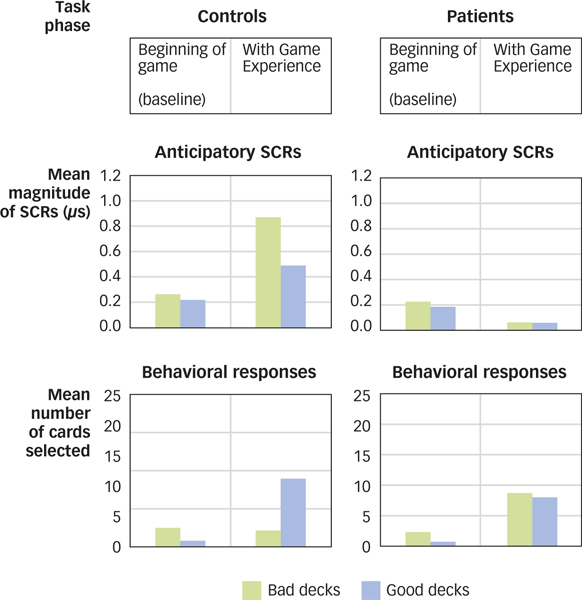
Further studies of the participants with prefrontal damage suggest that risky decision making grows out of insensitivity to the future consequences of behavior (Naqvi, Shiv, & Bechara, 2006). Unable to think beyond immediate consequences, they cannot shift their choices in response to a rising rate of losses or a declining rate of rewards (Bechara, Tranel, & Damasio, 2000). Recent neuroimaging studies suggest that the area of prefrontal cortex that is typically damaged in these patients is also activated in healthy people who perform well on the gambling task (Fukui et al., 2005; Lawrence et al., 2009). Together, the neuroimaging and lesion studies show that aspects of risky decision making depend critically on the prefrontal cortex.
What is the relationship of the prefrontal cortex to risky behavior?
Interestingly, substance-
293
SUMMARY QUIZ [9.3]
Question 9.8
| 1. | People give different answers to the same problem depending on how the problem is phrased because of |
- the availability bias.
- the conjunction fallacy.
- the representativeness heuristic.
- framing effects.
d.
Question 9.9
| 2. | The view that people choose to take on risk when evaluating potential losses and avoid risks when evaluating potential gains describes |
- the conjunction fallacy.
- the frequency format hypothesis.
- prospect theory.
- the sunk-
cost fallacy.
c.
Question 9.10
| 3. | People with damage to the prefrontal cortex are prone to |
- heightened anticipatory emotional reactions.
- risky decision making.
- galvanic skin response.
- extreme sensitivity to behavioral consequences.
b.