Descriptive Research
LO 9 Recognize the forms of descriptive research.
Suppose a researcher is interested in studying how the sudden arrival of drugs, sweets, and other prohibited goods affected the miners’ social interactions. This is a great topic for descriptive research, the type of investigation psychologists conduct when they need to describe and explore a phenomenon or topic. Descriptive research is primarily concerned with describing, and is useful for studying new or unexplored topics when researchers might not have specific expectations about outcomes. But there are some things descriptive research cannot achieve. This method provides us with clues to the causes of behaviors, but it cannot unearth cause-and-effect relationships, a point that we will return to later in the chapter. But first, we will explore four types of descriptive research methods.
Naturalistic Observation
One form of descriptive research is naturalistic observation, which involves studying participants in their natural environments using systematic observation. And when we say “natural environments,” we don’t necessarily mean the “wild.” It could be an office, a home, or even a preschool. In one naturalistic study of families with young children, researchers explored the interactions that occurred when parents dropped off their children at preschool. One variable of interest was the length of time it took parents to leave the children once they arrived at school. The researchers found that the longer parents or caregivers took to leave, the less time the children played with their peers and the more likely they were to stand by and watch other kids playing. The researchers also noted that women were somewhat more likely than men to hold the children and physically pick them up during drop-off. These drop-off interactions seemed to get in the way of children “settling into” the classroom (Grady, Ale, & Morris, 2012).

The most important feature of naturalistic observation is that researchers do not disturb the participants or their environment. Why? Imagine you were a participant in the naturalistic observation of families dropping off preschoolers. Researchers have been deployed throughout your child’s preschool, and every time you walk through the doors, you feel as if you’re under surveillance. Parking your car, you spot a researcher peeping at you from behind a tree; at the front office, you catch another one videotaping you. It would be extremely difficult for most people to behave naturally under these circumstances. It is important for researchers to be unobtrusive so participants don’t change their normal behaviors.
As with any type of research, naturalistic observation centers around variables, and those variables must be pinned down with operational definitions. Let’s say a researcher is interested in studying aggressiveness in enclosed spaces and decides to examine aggression among Los 33: an intriguing topic given that research has linked stress and hot temperatures to more aggressive behaviors (Anderson, 2001; Bushman, Wang, & Anderson, 2005; Kruk, Halász, Meelis, & Haller, 2004). At the beginning of the study, the researcher would need to operationally define aggression, including detailed descriptions of specific behaviors that illustrate it. Then she might create a checklist of aggressive behaviors like shouting and pushing, and a coding system to help keep track of them.
Avoiding the Pitfalls
Naturalistic observation allows psychologists to observe participants going about their business in their normal environments, without the disruptions of artificial laboratory settings. Some problems arise with this arrangement, however. Natural environments are cluttered with a variety of unwanted variables, and removing them alters the natural state of affairs you are striving to maintain. These environments are also very hard to control, making replication of the research more difficult. Suppose you opted to study the behavior of Los 33 during their heated dominoes matches. In this natural setting, you could not control who played and when; whoever showed up at the dominoes table became a participant in your study. You simply had to record the behaviors of your participants—whomever they ended up being.
29
Observer Bias
How can we be sure observers will do a good job recording behaviors? For example, a researcher who detests dominoes might be less inclined to pay attention to different aspects of domino-related behaviors than a researcher who relishes the game. One way to ensure that these types of issues do not intrude on a study is to include multiple observers and then determine how similarly they record the behaviors. If the observers don’t all rate in the same way, this suggests the presence of observer bias, which refers to errors introduced into the recording of observations due to a researcher’s value system, expectations, attitudes, and so forth.
Case Study
Another type of descriptive research method is the case study, a detailed examination of an individual or small group. Case studies typically involve collecting a vast amount of data on one particular person or group, often using multiple avenues to gather information. The process might include in-depth interviews with the person being studied and her friends, family, and co-workers, and questionnaires about medical history, career, and mental health. The goal of a case study is to provide a wealth of information from a variety of resources. Case studies are invaluable for studying rare events, like 33 Chilean miners cooped up in a subterranean hole, offering a window into this unusual experience. Unlike naturalistic observation, where the researcher assumes the role of detached spectator, the case study may require complete immersion in the participant’s environment. How do you think this might impact the researcher’s observations and the conclusions of the study? See TABLE 1.4 for some examples of classic case studies, many of which we will examine in later chapters to help us answer this question.
| Case Study | Description | Outcome |
| Phineas Gage | A railroad worker who survived after an iron rod blasted through his skull | Suggested the role that frontal lobes play in personality |
| H. M. | A man who suffered from profound memory loss following brain surgery | Showed how brain damage can be linked to memory loss |
| Little Albert | An 11-month-old who was conditioned to fear rats | Revealed the ability to classically condition fear in humans |
| The Genain Quadruplets | Identical quadruplet sisters who all developed schizophrenia | Demonstrated a genetic factor is involved in schizophrenia |
| “Rat Man” | A man with obsessive thoughts, including a punishment involving rats | Exemplified a case study on which Sigmund Freud based his theories |
| Lorenz’s Geese | Goslings that became attached to Konrad Lorenz | Documented the imprinting phenomenon |
| Summarized here are some of the most colorful case studies in the history of psychology. These classic studies have provided psychologists with valuable insights into human behaviors, and you will read about many of them in the chapters to come. | ||
30
Providing Clues
No matter how colorful or thought-provoking a case study may be, it cannot be used to support or refute a hypothesis (Stanovich, 2010). Like direct observation, the case study method can help to further develop theories, but it can’t provide answers to what is causing behaviors. This descriptive method can offer guidance for designing new studies on topics that may be relatively underexplored (Stanovich, 2010). But as knowledge advances and researchers are more concerned with testing hypotheses, the case study becomes increasingly irrelevant. Hypothesis testing involves drawing comparisons between different conditions (Stanovich, 2010). Case studies do not allow us to compare conditions to determine if there are other explanations for behaviors.
Suppose you are trying to examine how parent–child interactions at home might relate to preschoolers’ transitions during morning drop-off. What would happen if you limit your research to a case study of a family with two working parents and 10 children? The dynamics of this family may not be representative of those in other families. We must always be vigilant against drawing conclusions from a single person or group; the chosen case may be unique, thus making generalizations inaccurate.
Survey Method
One of the fastest ways to collect descriptive data is the survey method, which relies on questionnaires or interviews. A survey is basically a series of questions that can be administered on paper, in face-to-face interviews, via telephone, or through a few mouse clicks. Your college might send out surveys to gauge student attitudes about new online classes and e-books (How often do you encounter technical difficulties with your online courses? How would you rate your overall satisfaction with an assigned e-book?). The benefit of the survey method is that one can gather data from numerous people in a short period of time. Surveys can be used in conjunction with other research methods, but sometimes researchers use only surveys to gather their data. Survey findings often complement demographic data, psychological assessments, and other types of information.
Wording And Honesty
Like any research design, the survey method has its limitations. The wording of surveys can lead to biases in responses. A question with a positive or negative spin may sway a participant’s response one way or the other: Do you prefer a half-full glass of soda or a half-empty glass of soda? Take a look at Figure 1.4. for an example of how the wording of a survey can influence participant responses.
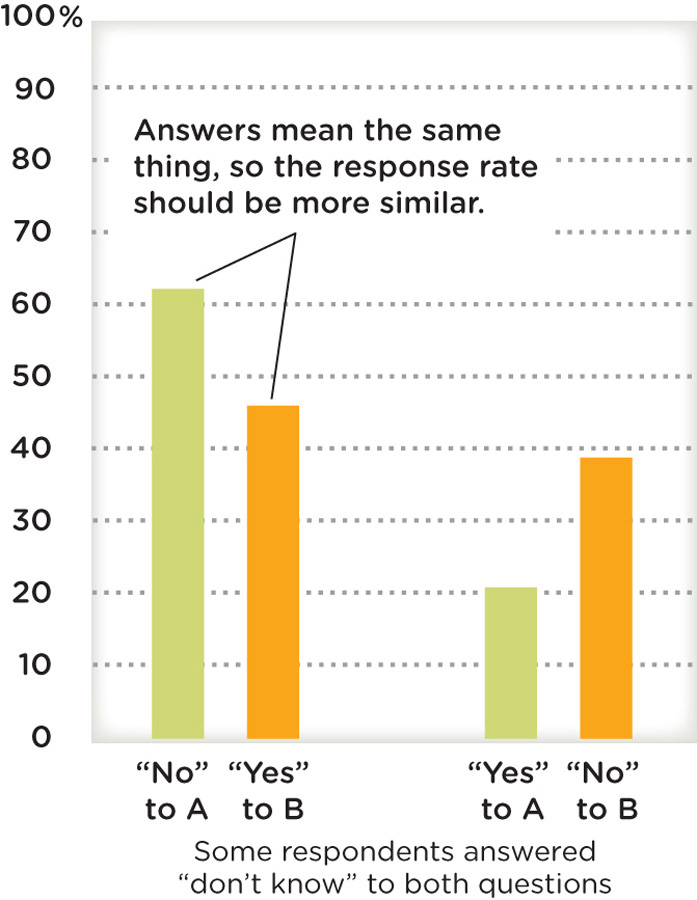
(A) Do you think the United States should allow public speeches against democracy?
(B) Do you think the United States should forbid public speeches against democracy?
Answering “no” to Question A (“not allow speeches”) should be the same as answering “yes” to Question B (“forbid speeches”). However, far more respondents answered “no” to Question A than answered “yes” to Question B. According to the researchers, “the ‘forbid’ phrasing makes the implied threat to civil liberties more apparent” than the “not allow” phrasing does (Rugg, 1941). And that’s something fewer people were willing to support.
More importantly, participants in studies using the survey method are not always forthright in their responses, particularly when they have to admit to things they are uncomfortable discussing face-to-face. In short, people lie. In one study, psychologists asked thousands of American women if they had ever cheated on their husbands. When a researcher questioned them in person, 1% of the wives admitted cheating; but when asked through a computer-based questionnaire, 6% confessed their infidelity (Whisman & Snyder, 2007). People often exhibit a desire not to reveal attitudes or behaviors that are embarrassing or deal with sensitive topics (Tourangeau & Yan, 2007). This may lead to an inaccurate representation of the attitudes and beliefs of participants.
Skimming the Surface
Another disadvantage of the survey method is that it tends to skim the surface of people’s beliefs or attitudes, failing to tap into the complex issues underlying responses. Ask 1,000 people if they intend to exercise regularly, and you might get more than a few affirmative responses. But yes might mean something quite different from one person to the next (“Yes it crosses my mind, but I can never go through with it” versus “Yes, I have a specific plan, and I have been able to follow through”). A simple yes/no question cannot distinguish between these vastly different answers, so the types of possible responses the survey includes (for example, yes/no, scale of 1 to 4) will certainly direct participants’ answers. To obtain more precise responses, researchers often ask people to respond to statements using a scale that indicates the degree to which they agree or disagree (for example, a 5-point scale ranging from strongly agree to strongly disagree), or the degree to which they have had an experience (for example, a 5-point scale ranging from never to almost always).
31
Representative Samples and Surveys
The representativeness of survey samples can also be called into question. Some surveys fail to achieve representative samples because their response rates fall short of ideal. If a researcher sends out 100 surveys to potential participants and only 20 people return them, how can we be sure that the answers of those 20 responders reflect those of the entire group? Without a representative sample, we cannot generalize the survey findings.
Correlational Method
The final form of descriptive research we will cover is the correlational method, which examines relationships among variables and assists researchers in making predictions. When researchers collect data on many variables, it can be useful to determine if these variables are related to each other in some way. A correlation represents a relationship or link between variables (Infographic 1.4). For example, there is probably a correlation between the years of working in a mine and yearly salary. The more time a miner has put in, the more cash he takes home. This is an example of a positive correlation. As one variable increases, so does the other. A negative correlation, on the other hand, means as one variable goes up the other goes down (an inverse relationship). A good example would be the number of days trapped in the mine and body weight (at least before rescuers started delivering food). As the number of days increased, the miners’ weight decreased. You have probably noticed correlations between variables in your own life. Increase the hours you devote to studying, and you will likely see your grades go up (a positive correlation). The more you hold a baby, the less she cries (a negative correlation).
Correlation Coefficient
Some variables are not related to each other whereas others have a link between them. Correlations indicate this type of information by representing the strength of a relationship between variables. Some relationships are strong and clear. Others are weak and barely noticeable. Lucky for researchers, there is one number that tells us how strong a relationship is and whether a relationship is positive or negative. Both of these characteristics of the relationship are portrayed by a correlation coefficient (symbolized as r), which is a statistical measure that indicates the strength and the direction of the relationship. Correlation coefficients range from +1.00 to −1.00, with positive numbers indicating a positive relationship between variables and negative numbers indicating an inverse relationship between variables. The closer r is to +1.00 or to −1.00, the stronger the relationship is. The closer r is to .00, the weaker the relationship is. When the correlation coefficient is very close to zero, there may be no relationship at all between the variables. An example of a nonexistent correlation might be shoe size and intelligence. Are people with bigger (or smaller) feet more intelligent? Probably not; there would be no link between the two variables, so the correlation coefficient between these variables (the r value) is around zero. Take a look at Infographic 1.4 to see how correlation coefficients are portrayed on graphs called scatterplots.
32
Third Variable
Even if there is a very strong correlation between two variables, this does not indicate that a causal link exists between them; no matter how high the r value is or how logical the relationship seems, it does not prove a cause-and-effect link. If you discover a positive relationship between the years worked in the mine and salary, it’s easy to jump to the conclusion that experience causes higher salary. However, it is possible that although they appear to be directly linked, there may be some other variable or characteristic influencing both of them. What additional variables might “cause” increased salary? One possibility is productivity, which could increase with the number of years on the job; more productive workers are rewarded with higher salaries. Another possibility is attendance: Seasoned workers may tend to miss fewer workdays as a result of on-the-job injuries; maybe they earn more money simply because they are able to clock more hours. In each case, we have a third variable, some unaccounted for characteristic of the participants or their environment that explains the changes in the two other variables. When you observe strong links between variables, consider other factors that could be related to both.
Now let’s consider the direction of the relationship between variables. With a positive correlation between years of mining experience and salary, you might have assumed that experience leads to increased salary. The longer you are at a job, the more raises you get. But maybe well-paid employees are more likely to retain their jobs than their lower-earning coworkers, and the salary level leads them to stay on the job. For most people, a large paycheck is a compelling reason to hold onto a job. If this is the case, then salary level leads to the number of years on the job, not the other way around; the direction of the relationship matters.
Remember this type of method can’t provide answers to what is causing behaviors or what the effects of behaviors are. It provides clues (description) to what underlies behaviors, but not definitive answers. Yet, correlational research is used when other types of experiments are unethical or impossible to do. If we wanted to determine the causal relationship between salary and years at work, we would not ethically be able to manipulate either variable. We couldn’t ask the mining company to fire people, keep people on, or change salaries just so we can determine what is really happening between these two variables. Sometimes descriptive research is our best choice, as you will see in the following example.
across the WORLD
The Many Faces of Facebook
 You probably know that Facebook is the most widely used social networking site in the world, far more popular than Twitter, LinkedIn, and MySpace (EBizMBA.com, 2012). But you may be surprised to learn that 81% of Facebook’s one billion users reside outside of North America (Facebook, 2012). Why do people in different parts of the world use this American invention? Do they use Facebook to rekindle an old friendship, create a new alliance, or spy on an ex?
WHAT’S THE NUMBER ONE REASON PEOPLE USE FACEBOOK?
Curious about patterns of Facebook use across time and culture, a team of European researchers set out to gather data from users in different countries (Vasalou, Joinson, & Courvoisier, 2010). With the help of Facebook walls and networks, they recruited 423 Facebook users from the United States, the United Kingdom, Italy, Greece, and France. Then they asked the participants to complete an online questionnaire and conducted a statistical analysis of the responses. Their findings were intriguing.
33
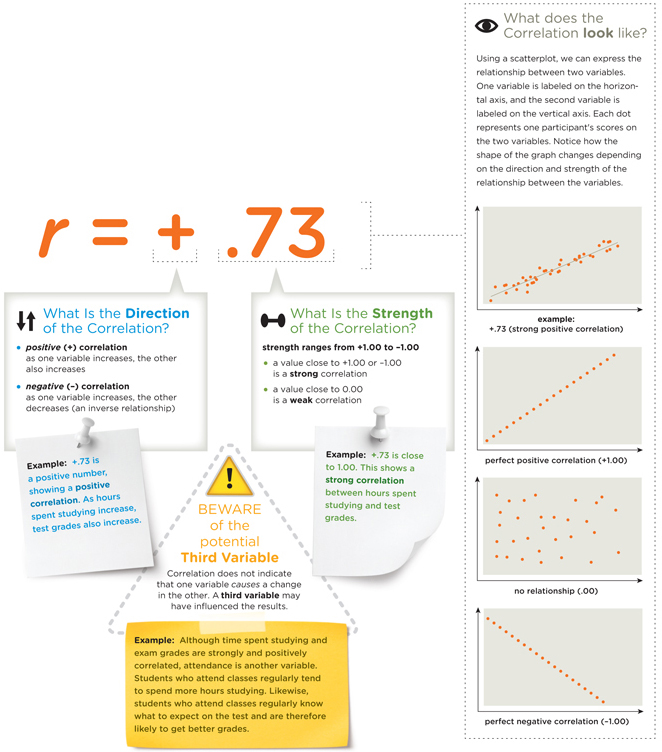
INFOGRAPHIC 1.4: The Correlation Coefficient: What’s in a Number?
A correlation indicates a relationship between two variables, such as the amount of time you spend studying and the grade you get on a test. This relationship is often indicated using a correlation coefficient, symbolized as r. To interpret the relationship using a correlation coefficient (r), ask yourself two questions:
(1) What is the direction of the relationship?
(2) What is the strength of the relationship?
A scatterplot helps us see what the correlation looks like.
And remember, a correlation between two variables does not necessarily mean that one variable caused the change in the other variable.
34
Across cultures, the primary motivation for using Facebook was “social searching,” or connecting with people already known outside of Facebook (friends, family, colleagues, and so on). In second place was “social browsing,” or looking for new acquaintances, which was particularly popular among French and Italian users. When it came to total time investment in Facebook, the British led the pack, averaging between 2 and 5 hours per week (compared to 2 hours or less for those in other countries). The British and the Italians invested a significant amount of time in groups, and the Italians showed a strong interest in games and applications. French and Greek users were not particularly interested in status updates, and the French did not place a high value on photographs (Vasalou et al., 2010). Take a look at Figure 1.5 for more information.
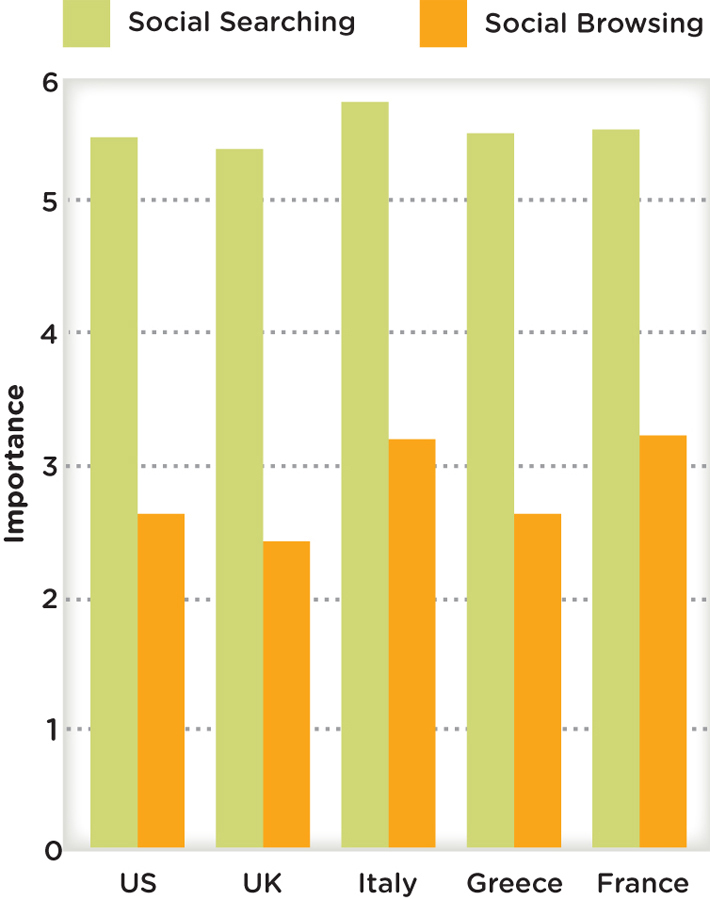
What do all these findings mean? Surely, there is a reason that French and Italian users are more inclined than their American counterparts to shop around for new contacts, and an explanation must exist for the French indifference toward photos. Finding answers to these phenomena was outside the scope of the study by Vasalou and colleagues. Surveys and other forms of descriptive research are information-gathering tools that illuminate behavioral tendencies, but they cannot explain the causes of those behaviors, which is the goal of experimental research, the focus of our next section.
Before moving on, let’s hammer home a few points about descriptive research, which is particularly useful when it comes to relatively unexplored topics. Data gleaned from descriptive research often steer the course for future studies and help psychologists develop hypotheses and fine-tune their theories. But for testing hypotheses and uncovering cause-and-effect relationships, descriptive research cannot provide us with definitive answers, only hints.
show what you know
Question 1.1
1. __________ is primarily useful for studying new or unexplored topics.
- An operational definition
- Observer bias
- Descriptive research
- A correlation
Question 1.2
2. A researcher was interested in studying the behaviors of parents dropping off children at preschool. He trained several teachers to use a checklist and a stopwatch to record how long it took a caregiver to enter and leave the classroom, as well as the subsequent behaviors of the children. This approach to collecting data is referred to as:
- naturalistic observation.
- representative sampling.
- informed consent.
- applied research.
Question 1.3
3. The longer a miner has worked for a mining company, the more money he makes. This is an example of a ____________________.
Question 1.4
4. Describe the strengths and weaknesses of descriptive research.
 CHECK YOUR ANSWERS IN APPENDIX C.