11.2 What Are the Capabilities of a Satellite Sensor?
spatial resolution the ground area represented by one pixel of satellite imagery
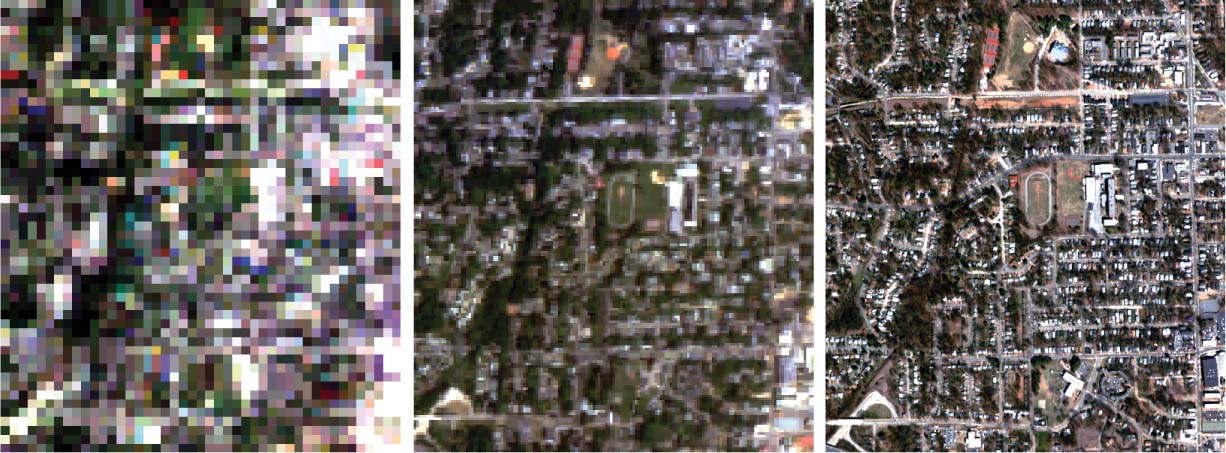
A satellite sensor has four characteristics that define its capabilities: spatial resolution, radiometric resolution, temporal resolution, and spectral resolution. In Chapter 10, we discussed the concept of resolution in the context of spatial resolution, with the area on the ground represented by one pixel in a satellite image. A sensor’s spatial resolution will affect the amount of detail that can be determined from the imagery—a sensor with a 1-meter spatial resolution has much finer resolution than a sensor with spatial resolution of 30 meters (see Figure 11.5 for examples of the same area viewed by different spatial resolutions). A satellite’s sensor is fixed with one spatial resolution for the imagery it collects—a 30-meter resolution sensor can’t be “adjusted” to collect 10-meter resolution images.
pan-sharpening the technique of fusing a higher-resolution panchromatic band with lower-resolution multispectral bands to improve the clarity and detail seen in the image
panchromatic sensor a sensor that can measure one range of wavelengths
If two bands (one with a higher resolution than the other) are used by the sensor to image the same area, the higher-resolution band can be used to sharpen the resolution of the lower-resolution band. This technique is referred to as pan-sharpening because the higher-resolution band used is a panchromatic band. As we discussed in Chapter 10, in terms of imagery, a panchromatic sensor will measure only one large band of wavelengths at once (usually the entire visible portion of the spectrum or the entire visible and part of the near-infrared spectrum). For example, a satellite (like Landsat 7) that senses the blue, green, and red portions of the electromagnetic spectrum at 30-meter resolution could also have a sensor equipped to view the entire visible portion of the spectrum and part of the near-infrared spectrum as a panchromatic band at 15-meter resolution. This panchromatic image can then be fused with the 30-meter resolution color imagery to create a higher-resolution color composite. Many satellites with high spatial resolution capabilities sense in a panchromatic band that allows for pan-sharpening of the imagery in the other bands.
362
radiometric resolution the degree of a sensor’s ability to determine fine differences in a band of energy measurements
As we mentioned in Chapter 10, a sensor scales the energy measurements into several different ranges (referred to as quantization levels) to assign brightness values to a pixel. The sensor’s radiometric resolution refers to its ability to measure fine differences in energy. For instance, a sensor with 8-bit radiometric resolution places the energy radiance values on a scale of 0 (lowest radiance) to 255 (highest radiance). The wider the range of measurements that can be made, the finer the sensor’s radiometric resolution is. The radiometric resolution (and the resulting number of levels) is a measure of the number of the sensor’s bits of precision. To calculate the number of levels, take the number of bits and apply it as an exponent to the number 2. For instance, a 6-bit sensor would have 64 levels (26) ranging from a value of 0 to a value of 63. An 8-bit sensor would have 256 levels (28) ranging from 0 to 255. An 11-bit sensor would have 2048 levels (211) ranging from 0 to 2047.
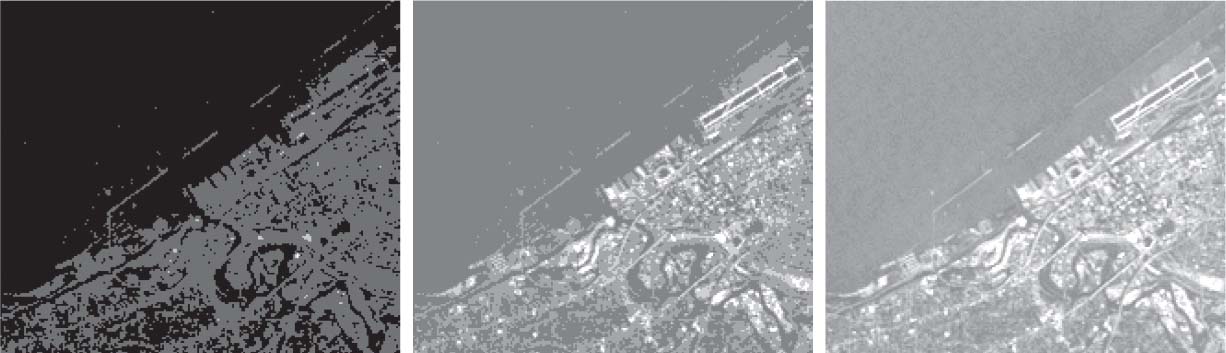
The finer a sensor’s radiometric resolution, the better it can discriminate between smaller differences in energy measurements. For example, a 2-bit sensor (22 or four values) would have to assign every pixel in an image a brightness value of 0, 1, 2, or 3, which would result in most pixels having the same value, and it would be difficult to distinguish between items or to create effective spectral signatures. However, an 11-bit sensor would assign a value anywhere from 0 to 2047, creating a much wider range of value levels and allowing much finer distinctions to be made between items. See Figure 11.6 for examples of differing effects of radiometric resolution on an image when performing remote sensing.
temporal resolution the length of time a sensor takes to come back and image the same location on the ground
off-nadir viewing the capability of a satellite to observe areas other than the ground directly below it
The sensor’s temporal resolution refers to how often the sensor can return to image the same spot on Earth’s surface. For instance, a sensor with 16-day temporal resolution will collect information about the swath containing your house and not return to image it again until 16 days have passed. The finer a sensor’s temporal resolution, the fewer days it will take between return times. A way to improve a sensor’s temporal resolution is to use off-nadir viewing capability, in which the sensor is not fixed to sense what’s directly below it (the nadir point). A sensor that is capable of viewing places off-nadir can be pointed to image locations away from the orbital path. Using off-nadir viewing can greatly increase a sensor’s temporal resolution, as the sensor can image a target several times during its orbits, even if the satellite isn’t directly overhead. This capability is a great help in monitoring conditions that can change quickly or require rapid responses (such as mitigating disasters resulting from hurricanes, tornadoes, or widespread fires). See Hands-on Application 11.2: Seeing What the Satellites Can See for an online tool that shows how much area on the ground a satellite can image (and the extent of any off-nadir capabilities).
363
!geo! HANDS-ON APPLICATION 11.2
Seeing What the Satellites Can See
Satellites can’t see everything at once. Because their orbits carry them over certain places at certain times, they can only image what’s in their swath, and off-nadir viewing can let the satellite see only so far away from its orbital path. Knowing when a satellite will be passing over an area (or if it can image areas outside its immediate swath) can be critical for a number of applications. For instance, emergency rescue and relief efforts rely on up-to-date imagery of what’s happening at a disaster site, so it’s extremely important to know when a particular satellite will be acquiring new imagery of that locale. If scientists are taking water quality samples of a lake in conjunction with multispectral imagery of the lake, they should time their data collection with a satellite overpass.
The Remote Sensing Planning Tool (RESPT) will show you, for a given day and time, what areas a satellite will pass over, how wide of a swath can be imaged, and what can be imaged through off-nadir capabilities. To get started, point your Web browser at http://ww2.rshgs.sc.edu. Select the option for Satellite Modeling, then select Predict Collection (multiple satellites). On the next screen, first select a satellite sensor (to start, choose GeoEye-1). Next, select today’s date in the calendar and a location—to start, choose Seattle, Washington, from the City Center list (note that you can enter a set of coordinates or another city if you want to predict satellite overpasses for a specific location); and for number of days, select 3 (to see all possible opportunities over a 3-day stretch). Next, click on Get all Opportunities. A list of all opportunities for imaging from the satellite will appear. From the first opportunity, click on Map Field of View (note: For GeoEye-1, there will be multiple options, but some satellites may only have one opportunity during the specified time). On the map, an icon showing the satellite will appear, as well as info showing its swath (in blue or green) and the range of off-nadir capabilities in red.
Expansion Questions:

Question
SxbNQ050UFOIK0cJD1hoVgFc2liIAodlg4QjMFE1ZziWCvwANqDIfygo2GbGcUbxGbxj7a8lGwrVZrv+RE5XQDHNYlASakqqzNMg+PJVQvUBaXH2jUhmiXccdbzZqTYU+R9T7RgB+vb2J97lEkcoIwFim9tkZlpkVfDYawryHSPdV4SPHoFOiwWHu4YddTtcZzQHbotNjr4cpr9l2W6rA6TdZ0kM4fa2/MpuzyZ3AUX4ObTHK/PGb8YajCRthi7fjW36vqDm+4SwSow1cT5VXxcTNKhonMk/iNdmtVl6UcA=-
Question
bZRhOb4hKX7LXs1ga29bGD34oDPtjmV7zmUYfroXxitGb+rOL6JwL9ckwjbY8ZJiAIebc1+j/UVhbdvK5vTxz/PhFb4su6HUi+51hBQY/XVb6JX4tjuYANC63rZXooaN9DyQXjU4mUrXSK67U/lH4VPRsVjeQKr6MK0MAdYhk2IRiROOzx1NkzVK0x0= -
Question
axT8pYr2rkcebAPMCUmzm/+sMqveX+TSeyka/fzuBmf7575vtafAeNeZCXDAGTcivvMp/o48DIDxCFX0JxmXvmmJRpRrD/J+cUaathA3VqhZEF0oz7q/DONGu0fenO31iTlBVOaZmeYqagCebnNjBUck4vpeyFbaWEDTmfesjqWTOBT4Qf8NBzkVxKeuXfNrpM982kZ8lUDu5JRhlDso3P/ciqqrxFqzVqPBmiFt9h7eUV1yhgn/+XnI3IKpQ5QXzG6YZmV6IUIUbdpp43OJb/76XAOHff3Mnc/FrygdhwSqs4wAZw8tpVEAsx9xqOIyz7zcCwkK+qd6WuEFrcnr3SiK+DuPJjF1qS53d4Qny+EM3ZVvsJSKPY7XRSeyown8v41Sq39WWc+NiNCgLCprQRrcDR+OP+yfTB7GhftCx3yZ0zpZ/tlQy9jH9aybBqjN
364
spectral resolution the bands and wavelengths measured by a sensor
The sensor’s last parameter is its spectral resolution, which refers to the bands and their wavelengths measured by the sensor. For instance, a sensor on the QuickBird satellite can measure four bands of energy simultaneously (wavelengths in the blue, green, red, and near-infrared portions of the spectrum), and the sensor onboard the Landsat 7 satellite can sense in seven different wavelengths at the same time. A sensor with a higher spectral resolution can examine several finer intervals of energy wavelengths (for example, the MODIS sensor onboard the Terra satellite—see Chapter 12—can sense in 36 different bands at once). Being able to sense numerous smaller wavelengths in the near-infrared portion of the spectrum gives much finer spectral resolution than just sensing one wider wavelength of near-infrared energy.