12.1 What Is Terra and What Can It Do?
Terra the flagship satellite of the EOS program
Morning Constellation a set of satellites (including Terra, Landsat 7, SAC-C, and EO-1), each one passing the Equator in the morning during its own orbit
Terra serves as the “flagship” satellite of the EOS program. It was launched in 1999 as a collaboration between the United States (NASA’s Goddard Space Flight Center, NASA’s Jet Propulsion Laboratory, and the NASA Langley Research Center) and agencies in Canada and Japan, and it continues its remote sensing mission today. Terra’s orbit is Sun synchronous, and it flies in formation as one of four satellites called the Morning Constellation. This series of satellites gets this name because Terra crosses the Equator at 10:30 a.m. each day (it was originally named EOS-AM-1 because of this morning crossing). The other satellites in this morning constellation are Landsat 7 (which passes at 10:01 a.m.), EO-1 (which passes at 10:02 a.m.), and another satellite called SAC-C.
388
“Terra” means “Earth” in Latin. It’s an appropriate name for the satellite, as its instruments provide numerous measures of (among many other functions) the processes involved with Earth’s land and climate. There are five instruments onboard Terra, each with its own purpose and environmental monitoring capabilities. The data and imagery collected by Terra’s instruments are processed into a number of specific products that are then distributed for use.
CERES the Clouds and Earth’s Radiant Energy System instruments onboard Terra and Aqua
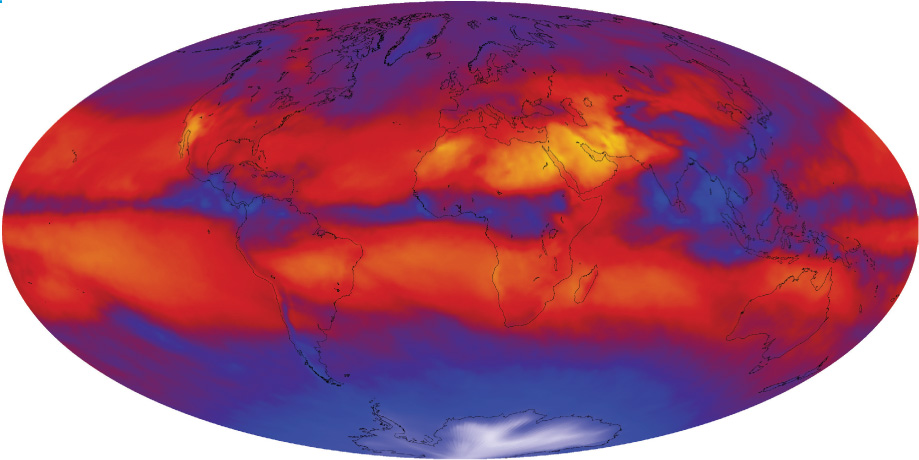
The first of Terra’s instruments is CERES (Clouds and Earth’s Radiant Energy System), a system designed to provide regular energy measurements (such as heat energy) from Earth’s surface to the top of the atmosphere. CERES is used to study clouds and their effect on Earth’s energy. CERES provides critical information about Earth’s climate and temperature. As NASA notes, clouds play a defining role in the heat budget of Earth, but different types of clouds affect Earth in different ways—for instance, low clouds reflect more sunlight (and thus, help cool the planet), while high clouds reflect less but effectively keep more heat on Earth. By combining CERES data with data from other EOS instruments, scientists are able to examine cloud properties and gather information about Earth’s heat and radiation (see Figure 12.2 for an example of using CERES for examining Earth’s radiated energy).
MISR the Multi-angle Imaging SpectroRadiometer instrument aboard Terra
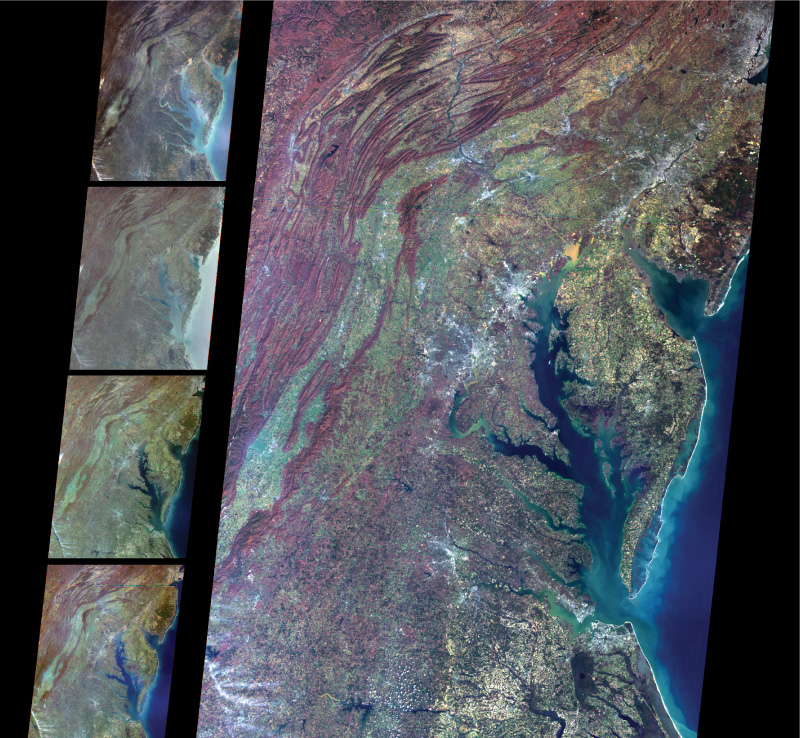
MISR (Multi-angle Imaging SpectroRadiometer) is the second of Terra’s instruments. It has nine sensors that examine Earth, but each sensor is set up at a different angle. One of these sensors is at nadir, four of them are set at forward-looking angles, and the remaining four are set at the same angles but look backwards. MISR is a multispectral sensor, meaning that objects on the ground get viewed nine times (from different angles) in multiple bands, which means that Terra can effectively cover the entire planet in about nine days. By viewing things at multiple angles, stereo imagery (see Chapter 14) can be constructed, allowing scientists to measure things like cloud heights and the heights of plumes of smoke given off by wildfires or volcanoes. In addition, by showing the same area nine times in rapid succession, the images can provide a series of very quick temporal snapshots of the same phenomenon (Figure 12.3).
389
MISR data aids in environmental and climate studies by enabling scientists to better examine how sunlight is scattered in different directions, particularly by aerosols and atmospheric particles. For instance, a NASA article by Rosemary Sullivant details how MISR can study air pollution in the form of tiny particulates (caused by things like automobile or factory emissions, or by smoke and dust from wildfires, volcanic eruptions, and other natural phenomena) that can lead to increased health risks. Detailed information on concentrations of aerosols and atmospheric particles can help scientists understand the level of exposure people are having to these types of pollutants. MISR is extremely sensitive to measuring these types of aerosols, and its data can help scientists tell the difference between what’s on the ground and what’s in the atmosphere. By using MISR (in conjunction with other instruments) to study aerosols, scientists can help determine areas of high aerosol concentrations and provide data to aid in cleaning up air pollution.
390
MOPITT the Measurements of Pollution in the Troposphere instrument onboard Terra
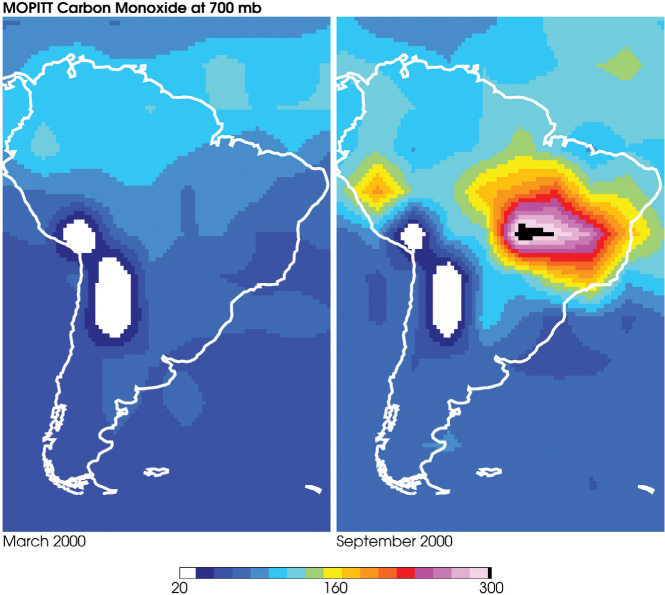
Another Terra instrument used for measuring airborne pollutants (but in a different way) is MOPITT (Measurements of Pollution in the Troposphere), which is designed for monitoring pollution levels in the lower atmosphere. MOPITT’s sensors collect information to measure the amount of air pollution concentrations across the planet, creating an entire global image about every three days. Specifically, MOPITT monitors carbon monoxide concentrations in Earth’s troposphere. Carbon monoxide, a global air pollutant, can be produced naturally as a result of volcanic eruptions and wildfires, or by human causes (such as vehicle emissions or industrial output). Being able to track long-term carbon monoxide sources can aid in determining areas generating large amounts of pollutants and then monitoring how those pollutants are being circulated through the atmosphere. Figure 12.4 shows an example of this kind of tracking in two MOPITT images of South America. The first, from March 2000, shows relatively low amounts of carbon monoxide. The second image, from September 2000, shows the dimensions of a large mass of carbon monoxide that was caused by biomass burning in the Amazon and the movement of carbon monoxide across the ocean to South America from fires in Africa.
MODIS the Moderate Resolution Imaging Spectroradiometer instrument onboard Terra and Aqua
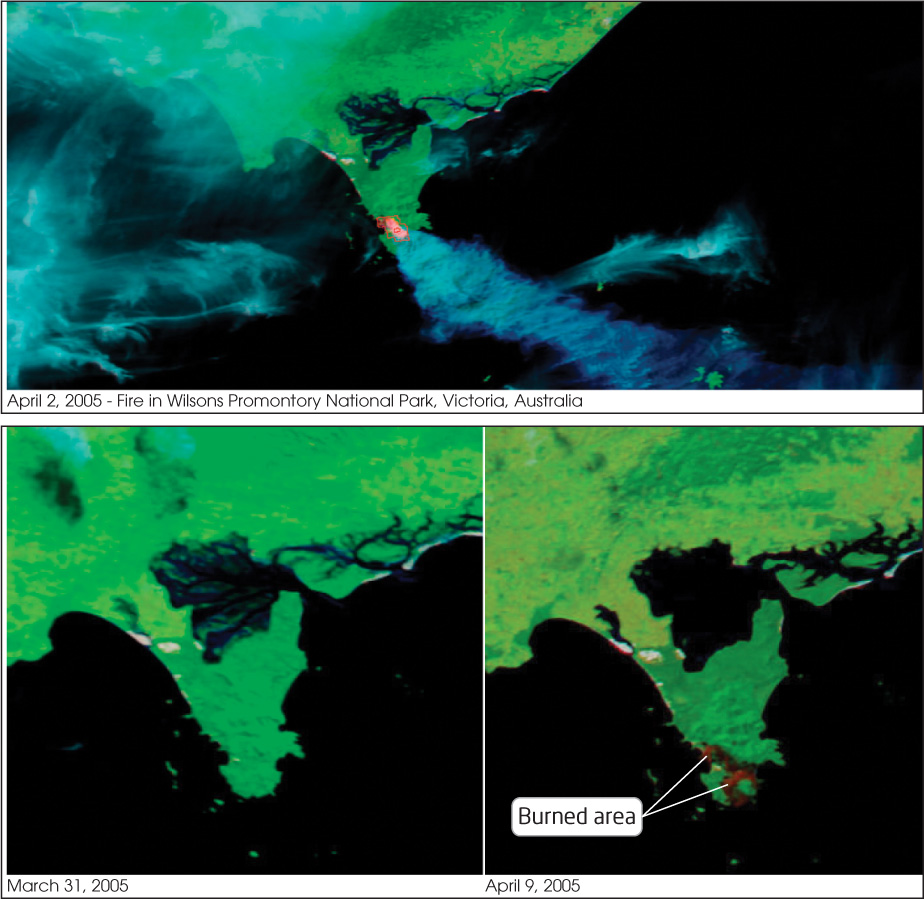
Probably the most widely used instrument onboard Terra is MODIS (the Moderate Resolution Imaging Spectroradiometer), a sensor that produces over 40 separate data products related to environmental monitoring. Being able to measure 36 spectral bands (including portions of the visible, infrared, and thermal) makes MODIS an extremely versatile remote sensing instrument, with multiple applications of its imagery—for instance, Figure 12.1 shows vegetation health and water temperatures. MODIS products are used to examine numerous types of environmental features, including (among many others) snow cover, sea surface temperature, sea ice coverage, ocean color, and volcanoes. In addition, MODIS’s thermal capabilities can track the heat emitted by wildfires, allowing for mapping of active fires across the globe (see Figure 12.5 for an example of MODIS imagery of fires and their aftermath recorded in Wilsons Promontory National Park in Australia).
391
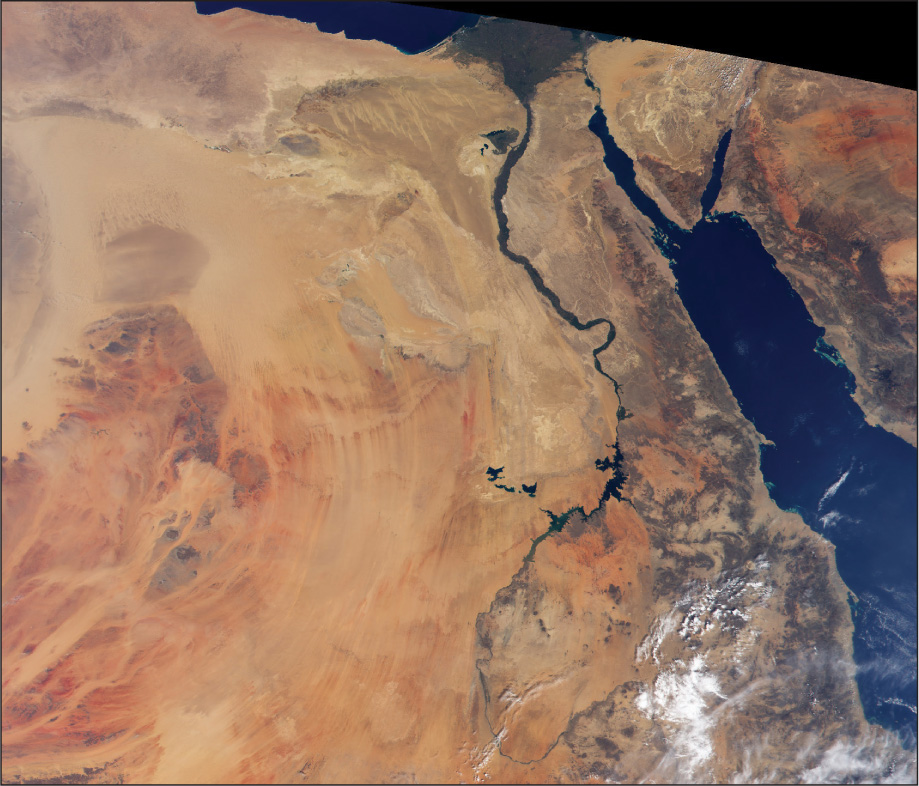
MODIS imagery has very coarse spatial resolution (most images have 1-kilometer resolution). However, the swath width of MODIS is 2330 kilometers, making it possible to examine broad-scale phenomena of large geographic regions. MODIS views most of the globe in one day with complete global coverage being completed on a second day. With this quick revisit time, MODIS allows scientists to look at changes in sea surface temperature or snow cover over time, make rapid and long-term global leaf-area index studies, and track active large-scale fires, all on a regular basis. For instance, the red and near-infrared bands sensed by MODIS can be used to regularly compute global measures of NDVI (see Chapter 10), thus allowing for the constant monitoring of the health of the planet’s trees and vegetation. Another application of MODIS lets researchers study the health of phytoplankton in the oceans. As NASA notes, when phytoplankton are unhealthy or under heavy stress, they take the sunlight they have absorbed and re-emit it as fluorescence, which can then be observed by MODIS. In this way, scientists can track potential harmful algal (phytoplankton) blooms around the world via MODIS. See Figure 12.6 for an example of MODIS imagery of Egypt and the River Nile—new lakes in the desert are visible adjoining the Nile. Also, check out Hands-on Application 12.1: MODIS Rapid-Fire Online for examples of current MODIS imagery online.
392
!geo! HANDS-ON APPLICATION 12.1
MODIS Rapid-Fire Online
Recent and archived MODIS data is available online at NASA’s MODIS Rapid Response System. Open your Web browser and go to http://rapidfire.sci.gsfc.nasa.gov/gallery. Several MODIS images (not the raw data, but processed images) can be viewed. Check out some of the images from recent dates, and see what kind of phenomena NASA is tracking. Click “Display most recent images” on the Web page for the most recent MODIS acquisition data available. Use the imagery from today’s date (or if today’s date isn’t available yet, use the most recent day). In this chapter’s Geospatial Lab Application, you’ll examine more MODIS imagery using some other sources available from NASA.
Expansion Questions:

Question
A32MovbncRcDx72Opi2TcVG721L0ahMrTPoY4Q7IfYEO1Ded0hgmQC1/EqmRKtExDYN9nZh4Q1uD5X/Czj3g6tHbjfsvBTSx99coJ5BNbw8=-
Question
JVYtQA6KoETzcq4wVkEiBOKzITgI/ej5uD816yuCnhcmPbWEhaJN7c0Lfycm6hdhXE8O5uiU1tCrOiyaiGzt83KwamdEnEjNdGS9DZMANI3AHiutytFVhGYsckeKM5U3
393
ASTER the Advanced Spaceborne Thermal Emission and Reflection Radiometer instrument onboard Terra
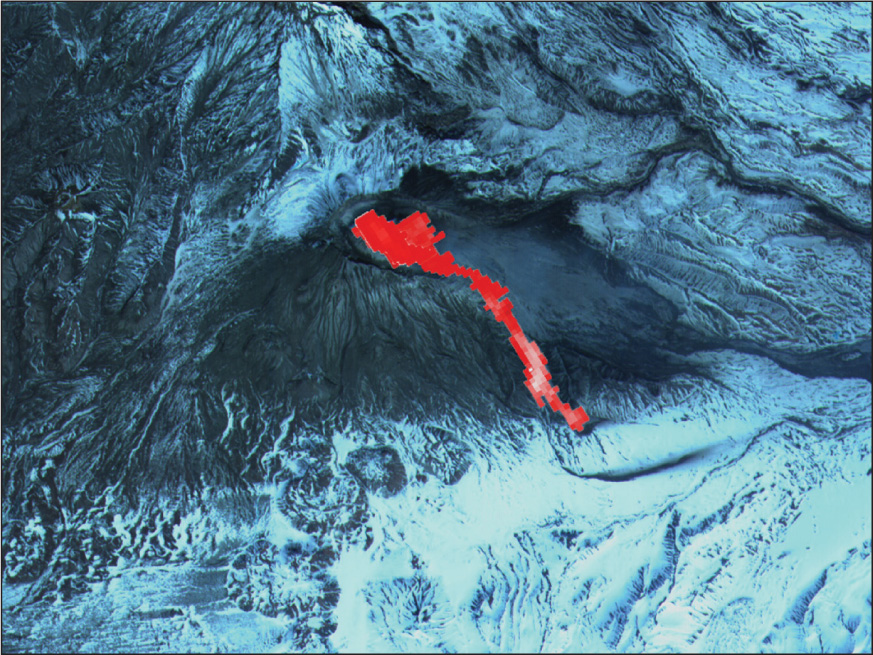
The last Terra instrument is ASTER (Advanced Spaceborne Thermal Emission and Reflection Radiometer). ASTER has relatively high spatial resolution and is often referred to as a sort of “zoom lens” for Terra’s other instruments. With its thermal and infrared measurements, ASTER is also used to obtain information about land surface temperature. In addition, through ASTER’s thermal capabilities, natural hazards such as wildfires can be monitored, and phenomena such as volcanoes can be observed and data obtained on their health and lava flows (see Figure 12.7 for an example of ASTER imagery of the lava flow from the Bezymianny volcano on Russia’s Kamchatka Peninsula). See Hands-on Application 12.2: ASTER Applications for further examples of ASTER imagery.
!geo! HANDS-ON APPLICATION 12.2
ASTER Applications
For a look at a variety of other applications of ASTER, open your Web browser and go to http://asterweb.jpl.nasa.gov/gallerymap.asp—this is the ASTER Web Image Gallery, a collection of imagery detailing how ASTER is used in a wide variety of real-world situations. You can select a geographic location from the map (for instance, select some of the options nearest to where you are now), or choose from the categories on the left-hand menu. Check out how ASTER is used for archeology, geology, and hydrology, and also for various environmental studies.
Expansion Questions:
-
Question
Y4XPKULIiHjwnYxGDplLJ1pQiBNxfkM8zWc/p6N01lIj+uk/T2+wEfxq+WmpXPZbXAThO9UvvJI9hI+HDYhIT+UHJJ8T/sLcLW5/2Pir146bjyYbJnsAekickLPX676QqWYKeU6uxR6z9jt4JdVoVw== -
Question
zA/KEdkGYCmdCu/SU6W3y8NJNg6NLfbPLkI3pKcEqqvu6OrhnVcjre3yMN+2zUXZh0tFVh5MphwEYRPiaRYuGXN/d4cvjIGlh/UkUN/2gmFrQOwwqacTcg==
394