12.3 What Is Aura and What Does It Do?
Aura An important EOS satellite dedicated to monitoring Earth’s atmospheric chemistry
A-Train Another term for the Afternoon Constellation
Afternoon Constellation a set of satellites (including Aqua and Aura) that pass the Equator in the afternoon during their orbits
The Aura EOS satellite was designed as a collaboration between NASA and agencies in Finland, the Netherlands, and the United Kingdom. In Latin, “Aura” means “breeze,” which helps describe the satellite’s mission—examination of elements in the air, especially the chemistry of Earth’s atmosphere. Aura orbits in formation with Aqua and other EOS satellites to form what is referred to as the A-Train of satellites.
397
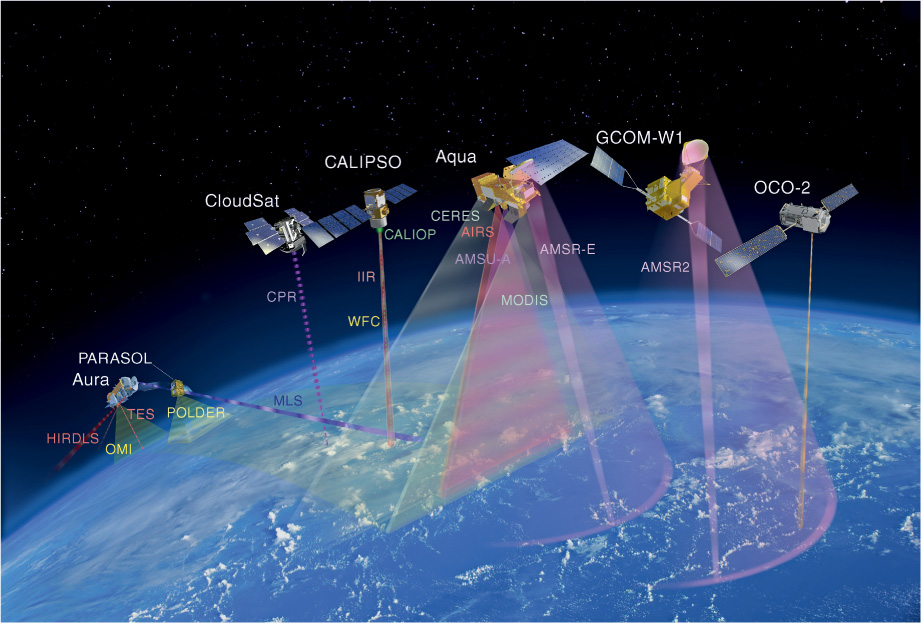
This organization of satellites is called the A-Train for two reasons: because it serves as the Afternoon Constellation of satellites (to complement the Morning Constellation that Terra flies in) and also because two of the key satellites (Aqua and Aura) begin with the letter “A.” Currently, a new satellite called GCOM-W1 (the Global Change Observation Mission-Water, also referred to as “SHIZUKU”) flies lead in the constellation. Currently planned for a July 2014 launch, OCO-2, a satellite designed to measure global carbon dioxide, will become the new lead. Aqua comes next, CALIPSO follows closely after, then CloudSat follows about 103 seconds later, and Aura brings up the rear (Figure 12.10). A satellite called PARASOL used to orbit before Aura, but it was removed from the formation on December 2, 2009. Other satellites are currently planned to become part of the A-Train after their launches. The combined data from the A-Train of satellites give scientists a rich data set for analysis of climate change questions.
HIRDLS the High Resolution Dynamics Limb Sounder instrument onboard Aura
MLS the Microwave Limb Sounder instrument onboard Aura
TES the Tropospheric Emission Spectrometer instrument onboard Aura
Aura carries four instruments onboard, each utilized in some type of atmospheric observation (such as ozone concentrations or air quality) as it relates to global climate change. The first, HIRDLS (High Resolution Dynamics Limb Sounder), measures temperature, levels of water vapor, ozone, and other trace gases to examine qualities such as the transportation of air from one section of the atmosphere to another. As NASA notes, HIRDLS data is also used to examine pollution to see what is naturally occurring (from ozone) and what is generated by human activity. Similarly, Aura’s MLS (Microwave Limb Sounder) instrument senses microwave emissions in five bands to examine carbon monoxide and ozone in the atmosphere. MLS data can be used as an aid in measuring ozone destruction in the atmosphere. Aura’s third instrument, TES (Tropospheric Emission Spectrometer), measures things related to pollution, including ozone and carbon monoxide. Since TES is capable of sensing from the land surface up into the atmosphere, its data can be used to assess air-quality levels in urban areas by measuring the levels of pollutants and ozone in cities.
398
OMI the Ozone Monitoring Instrument onboard Aura
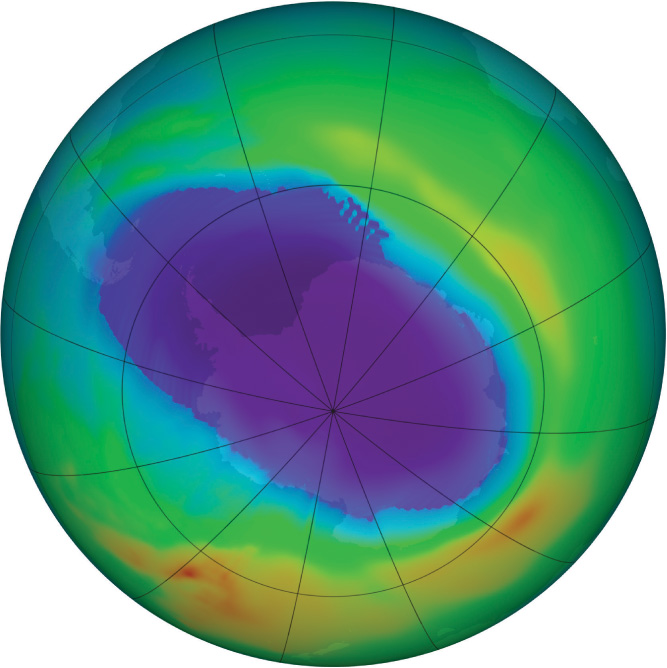
Aura’s final instrument is OMI (Ozone Monitoring Instrument), which (as the name implies) is dedicated to keeping an eye on changes in ozone levels in the troposphere. OMI is a hyperspectral sensor that views sections of the visible-light spectrum as well as the ultraviolet portion of the electromagnetic spectrum. We have already discussed (in Chapter 10) how the atmosphere absorbs a lot of electromagnetic radiation and also how ozone is the primary greenhouse gas that absorbs harmful ultraviolet light. OMI data aids scientists in measuring the amount of ultraviolet radiation penetrating to Earth by examining clouds and ozone levels. Figure 12.11 shows an example of imagery from OMI, showing the thinning (or hole) in the ozone layer above Antarctica. See Hands-on Application 12.4: Aura Products and the Visible Earth for more examples of Aura’s instruments’ applications.
399
!geo! HANDS-ON APPLICATION 12.4
Aura Products and the Visible Earth
When examining some applications of Aura’s instruments, the Visible Earth (like in Hands-on Application 12.3: Aqua Products and the Visible Earth) is a great reference. Open your Web browser and go to http://visibleearth.nasa.gov/view_cat.php?categoryID=1497.
Expansion Questions:

Question
7iGUzE39txrlwANH4/lGd2eFVzZt/KkMXDfHUD15RK46ZxvJ0IubA4IEHmOY5MW+/Z7E848STIezsyQVN5L/sZcnQEXTZeeC6KcdWOoUGinkbFTXzfM5nwsWFWQ=-
Question
xMSXWLu4YVoWB0Ylj1zgMDjtPRVtOaEk43szjPfunPGZCJFHihxjsp1q6irjjFv/R+PRz311J08qRIgjJB5htJSXesBNyS9wc5zZnTbJCUQX26h5SJYFTzQ6hcZk9FsbSRLX4sB3EtNJNdQEOulS2/5ngfUKqPmzHdhKTcK3NMEMT8nuAGw9vUQZy1Uqb/doAmwnFrBzxWV2A4VKMEeD5jgx6DA6cavj53zsmDVREg5YCrtRVGDbgUR27WY/NBPs2nhmDP91s/g2449eMyTMJzZJP2aelj6dzpoSdhSu2TvGK8R6dC4Tmb1+gvbbNV0chCtxdSnxM0kVfD0WkMiyNp5xF7UUIYk6Bj3xZ3c5H5VF6H4XM3rEP+OegiM= -
Question
Ce2Y6BcRKUhwSFMHVe4N5ILqg0OBO21Rrjoecr0oNBJgxD2z7etf8s6QJd+HT6Zgxtdcno4sk+5FcrA9uOMhdc7jS239tsWJV329Q+nyM46/uX05b8faAC9kSGq+un9nnage0eU197Y2EYIII0Zz2c9lfyiLAWOX2fSJrcVuLIy7zlKqWlmoKOolO4dDTQZI479whFuWc077qregESdcXV52t1PZ70FDTKTrlI8QVvFTeFdQ+GFAT0JtkK+PSB052c0EysyYogesqia2YzLKd97PE7jzT2hGCUpNpn5IEJlPjKTSBb3aHymYJSKigleb7oekz2iIhPAhv0oOj8gn+Jg1gZYLjyHC
!search! THINKING CRITICALLY WITH GEOSPATIAL TECHNOLOGY 12.1
How Can EOS Data Be Used in Studying and Monitoring Climate Change?
Climate change studies are going to be heavily reliant on accurate data related to Earth’s climatic conditions and temperature changes as well as to the kinds of environmental conditions that influence alterations in Earth’s processes. Changes in Earth’s surface temperature are often used as indicators of climate change. What other indicators are used to study global climate change? Which instruments onboard EOS satellites can be used as data sources for each of these types of indicators?