Digital Landscaping
417
Digital Topographic Maps, Contours, Digital Terrain Modeling,
Digital Elevation Models (DEMs), NED, SRTM, LIDAR,
and 3D Views of Landscapes and Terrain
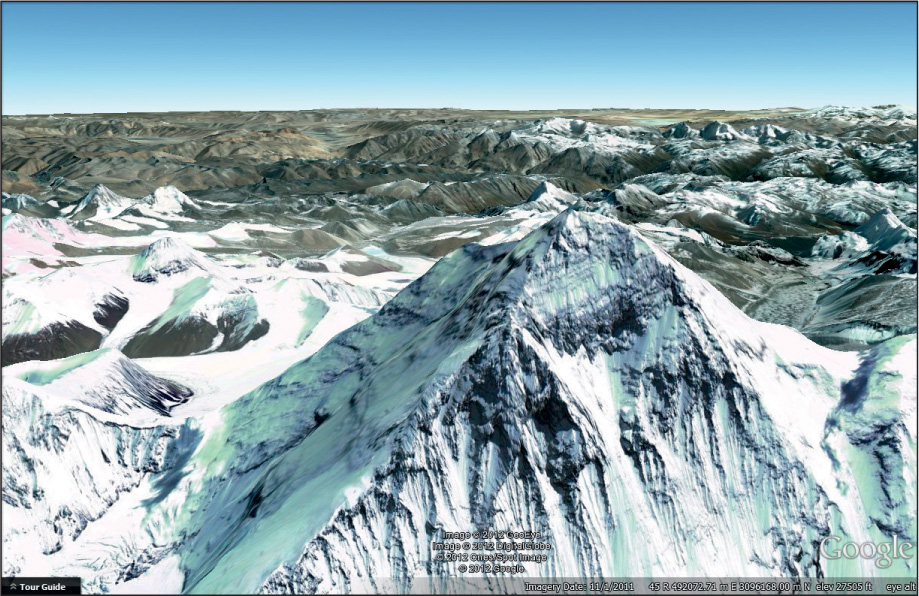
There’s one big element missing in geospatial technology that we haven’t yet dealt with: the terrain and surface of Earth. All of the maps, imagery, and coordinates (while taking into account numerous critical features of the planet) have been dealing with two-dimensional (2D) images of either the surface or the developed or natural features on the land. We haven’t yet described how the actual landscape can be modeled with geospatial technology. This chapter delves into how terrain features can be described, modeled, and analyzed using several of the geospatial tools (like GIS and remote sensing) that we’re already familiar with. Whether you are modeling topographic features for construction or recreational opportunities, or you’re just interested in seeing what the view from above looks like, the landforms on Earth’s surface are a principal subject for geospatial analysis (see Figure 13.1 for an example of visualizing Mount Everest with Google Earth).
z-value the elevation assigned to an x/y coordinate
vertical datum a baseline used as a starting point in measuring elevation values (which are either above or below this value)
First, when we’re examining landforms on Earth’s surface, we will have to assign an elevation to each location. In terms of coordinates, each x/y pair will now have a z-value accompanying it that will indicate that location’s elevation. These elevations have to be measured relative to something—when a point has an elevation of 900 feet, this indicates that it is 900 feet above something. The “something” represents a baseline, or vertical datum, that is the zero point for elevation measurements. Some maps of landforms indicate that the vertical datum is taken as mean sea level (represented by the National Vertical Datum of 1929). When this vertical datum is used and an elevation value on a map indicates 1000 feet, that number can be read as 1000 feet above mean sea level. Other geospatial data in North America utilize the North American Vertical Datum of 1988 (NAVD88). Coastal terrain models may also use mean high water.
418