13.5 How Can You Make Terrain Look More Realistic?
pseudo-3D a term often used to describe the perspective view of a terrain model since it is often a 2.5D model, not a full 3D model
perspective view the oblique angle view of a digital terrain model from which the model takes on a “three-dimensional” appearance
Digital terrain models aren’t just limited to flat images (like a DRG) on a computer screen or a paper map—remember, constructs like DEMs are 2.5D models, and since they have a z-value, that z-value can be visualized in a 3D view. It’s more accurate to say these types of visualizations are really pseudo-3D views since they’re really 2.5D, but they are not really full 3D models. Setting up a pseudo-3D view of a digital terrain model involves examining it at a perspective view (or an oblique view). Points or raster cells are elevated to the height of their z-value, and the resultant model is shown from an angular view. In this way, mountain peaks can be seen jutting up from the surface, and a meteor crater looks like a depression in the ground.
428
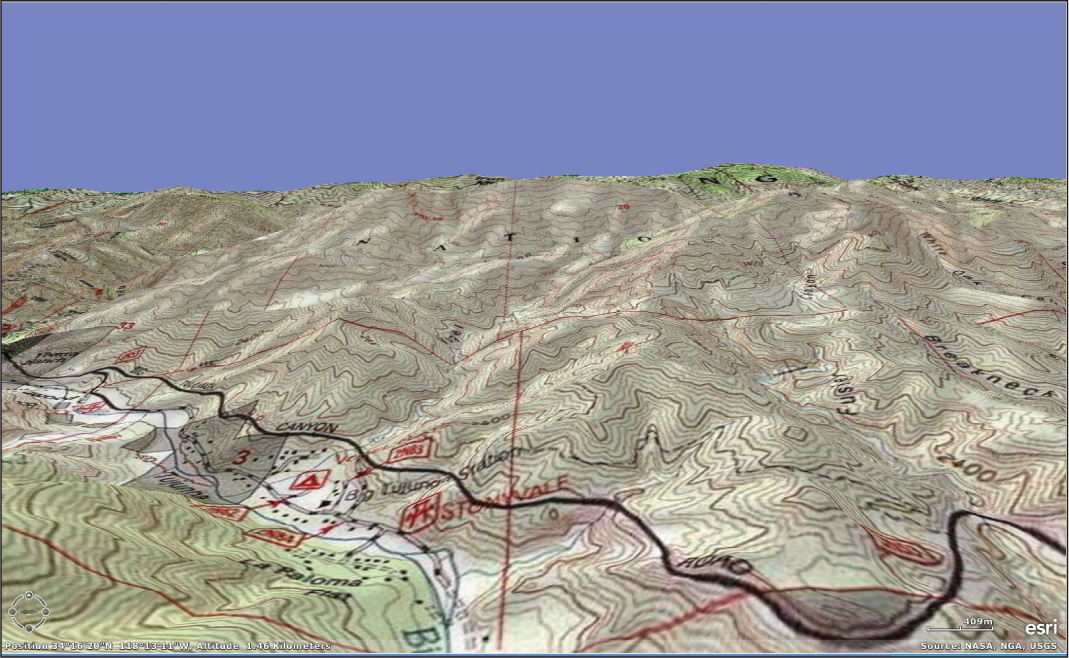
In many geospatial technology applications, the model becomes interactive, allowing the user to move or “fly” over the terrain, skimming over the surface and banking past mountains. Beyond viewing the terrain in perspective view, there are numerous ways of artificially altering the appearance of the terrain to make it more realistic-looking. One way is to drape imagery over the surface (see Figure 13.10 for an example of a terrain surface shown in perspective view with a digital topographic map overlaid to show off the contour lines in relation to the pseudo-3D model).
hillshade a shaded relief map of the terrain created by modeling the position of the Sun in the sky relative to the landscape
Sun altitude the value between 0 and 90 used in constructing a hillshade to model the Sun’s elevation above the terrain
Sun azimuth the value between 0 and 360 used in constructing a hillshade to model the Sun’s position in the sky to show the direction of the Sun’s rays striking the surface
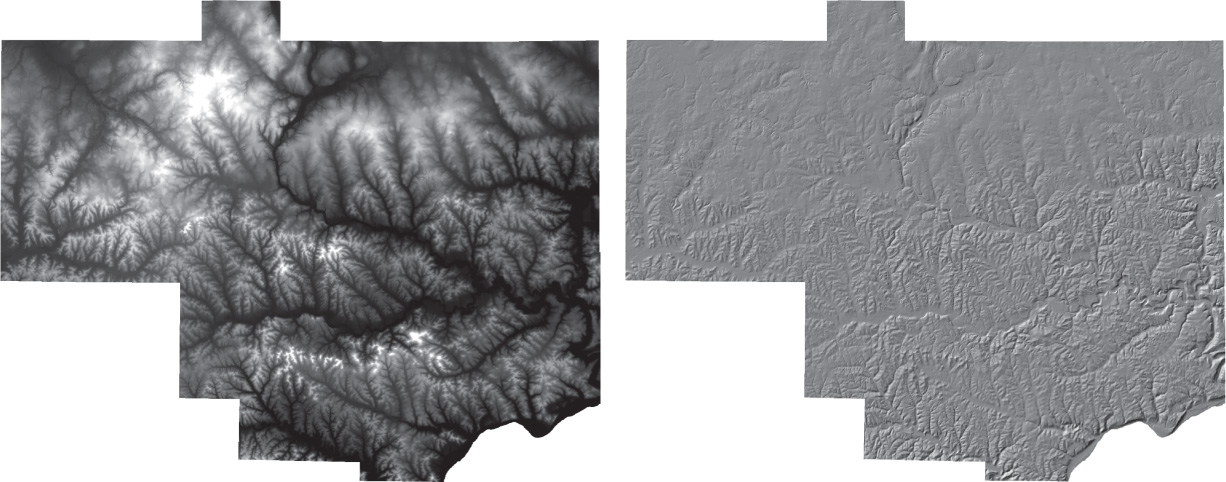
Remember that a DEM (like other digital terrain models) is just a map or grid of elevation surfaces. Like any other map, it can be displayed with various color ramps to show the differences in elevations, but there are several ways to make the terrain model look more realistic (and start to resemble that image of Mount Everest at the beginning of this chapter). The first of these techniques is called a hillshade, which models how the terrain would look under different lighting conditions (based on the location of the Sun in the sky). When you’re constructing a hillshade, you can calculate where the light source (that is, the Sun) will be located at different times with respect to the terrain, and you can simulate the effects of shadows cast on the landscape by the various terrain features.
By setting two parameters for the Sun, you can determine different appearances of the terrain at different times of day. The first parameter is the Sun altitude, a value between 0 and 90, representing the angle of the Sun in the sky between 0 degrees (directly at the surface) and 90 degrees (directly overhead). The second parameter is the Sun azimuth, a value between 0 and 360, representing the location of the Sun in relation to where its rays are coming from. The values represent a circle around the landscape, with 0 being due north, 90 being due east, 180 being due south, and 270 being due west (the values are measured clockwise from due north). By setting values for Sun altitude and Sun azimuth, the terrain can take on various appearances to simulate how the landscape looks at different times and in different conditions during the day. A hillshade using a Sun altitude of 45 degrees and a Sun azimuth of 315 degrees is shown in Figure 13.11.
429
draping a process in which an image is given z-values to match the heights in a digital terrain model
base heights the z-values of a digital terrain model that can then be applied to an image in the process of draping
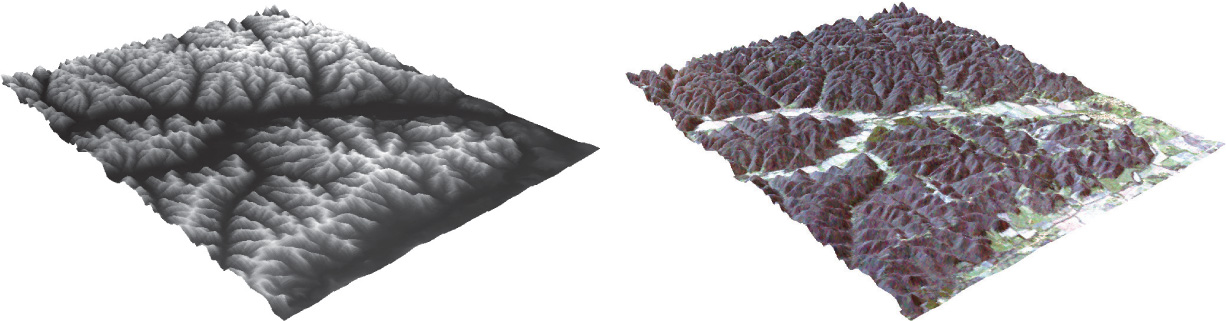
Hillshading provides a good shaded map of what the terrain will look like in various lighting conditions, but there are plenty of features on the landscape (likes roads and land cover) that aren’t shown with a hillshade. In order to see these types of features, we can use a process called draping, which essentially shows the terrain model with a remotely sensed image (or another dataset) on top of it. Figure 13.12 shows an example of a Landsat TM image draped over a DEM. Draping is achieved by first aligning the image with its corresponding places on the terrain model, then assigning the z-values from those locations on the terrain (in Esri terminology, these are referred to as base heights) to those locations on the image. In essence, locations on the image are assigned a z-value that corresponds with the terrain model.
430
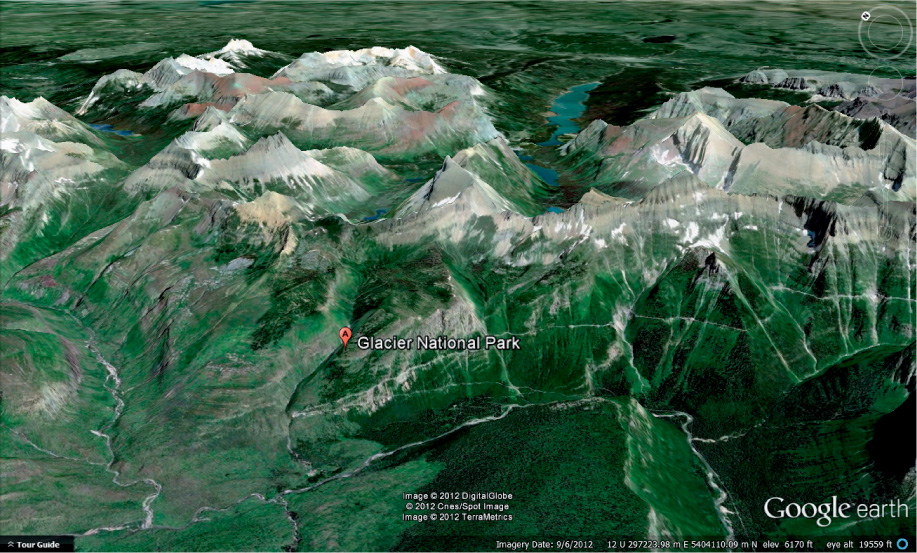
Draping is a common technique to show remotely sensed imagery on terrain features (the terrain model of Mount Everest in Figure 13.1 appears in this way). Programs such as Google Earth can show pseudo-3D landscapes by draping imagery over the underlying terrain models (see Figure 13.13). By creating a new draped image in perspective view, we can get new visual information about the appearance of the landscape that’s not directly obtainable through an examination of contours, DRGs, or non-perspective DEMs (see Hands-on Application 13.4: Terrain and Imagery Examples in Google Earth for more information). For example, draping a DRG over a DEM and looking at it in perspective can demonstrate visually how contour lines match up with the elevations that they represent.
!geo! HANDS-ON APPLICATION 13.4
Terrain and Imagery: Examples in Google Earth
Start up Google Earth, and search for Glacier National Park in Montana. Use the zoom slider and the other Google Earth navigation tools to change the view so that you’re examining the mountains and terrain of Glacier in a perspective view. Remember that what you’re examining here is imagery that has been draped over a digital terrain model representing the landscape of this section of the country. Fly around the Glacier area (see Figure 13.13 for an example), and get a feel for navigation over draped imagery. You’ll be doing more of this (among many other things) in Geospatial Lab Application 13.1.
Expansion Questions:

Question
boWr4Rh/NSlJTMleGrLXAKtew2cE9q75RUWhtXOPMj+JTgVJETcrAZGQ9zzEanD6izNSkP7s9VY02KGggiopDC77WB9Kd4lykC8ID1ZqB/QyZB2LLMhvu8eoGG+lVo0Q86qO0OqNX+S+vIFuSrjyr+3mjQ5Gv0rneTiUh9jeUZHKUwzzc4CdIQ==-
Question
1MBbw1G8aOIGZTrAaXcAv2onwyN8KqD9/GkpBXC05rvzJLMVdOIFNNmm7p0cSf8RzSM2DjhyrzbkjVyfY/9rFa7LV6S1/TlSgxI2dJn74YxNEZmxszyTjV8FQF2LQ6cmHS/gSc2GR+zMP9Jdk9/TtedeuIRElgxHN3kBITMu3eEb1rbKHx1RGNfuuMA/W51twDgUaIDKZ+wg0rDYpjczghy2NwY=
431
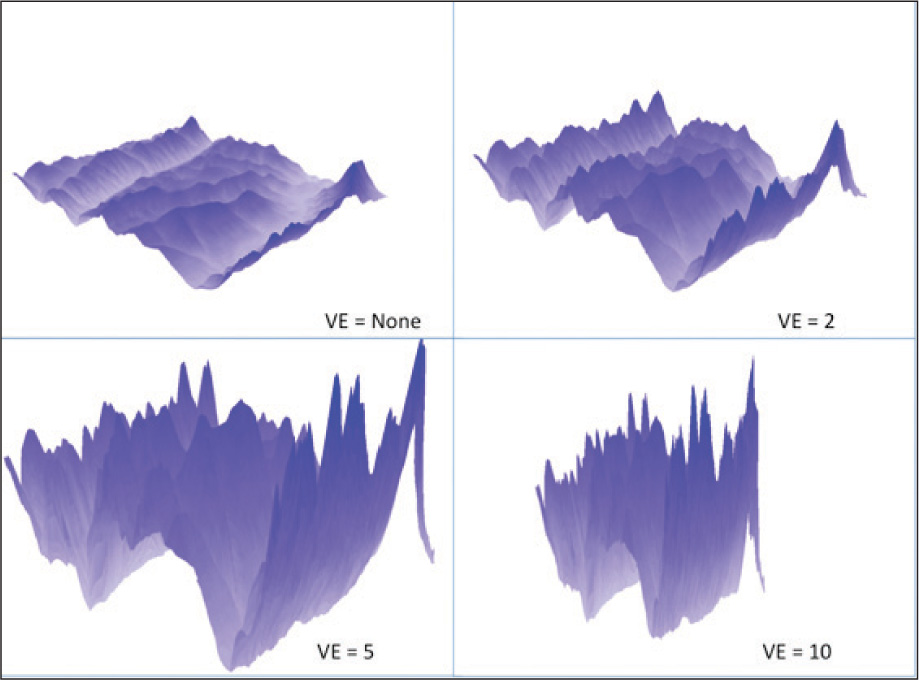
vertical exaggeration a process whereby the z-values are artificially enhanced for purposes of terrain visualization
Even with hillshading or draping to improve the terrain’s appearance, there’s no getting around the fact that some sections of terrain don’t have much variety in terms of changing elevations and features. In these cases, differences in landscape elevations or slopes may be difficult to see when viewing or interacting with a digital terrain model. The solution is to artificially enhance the differences between elevations so that the landscape can be better visualized. Vertical exaggeration is the process of artificially altering the terrain model for visualization purposes so that the vertical scale of the digital terrain model is larger than the horizontal scale. If the model’s vertical exaggeration is “5x,” then the vertical scale (the z-values) will be five times that of the horizontal scale. These types of artificial changes can really enhance certain vertical features (for example, valleys appear deeper, and peaks appear higher) for visual purposes. The downside to vertical exaggeration is that it alters the scale of the data and should be used only for visualizing the data. For a comparison of different vertical exaggerations applied to a DEM, see Figure 13.14.