See the World in 3D
445
3D Geovisualization, 3D Modeling and Design,
Prism Maps, SketchUp, and
Google Earth in 3D
Up until the previous chapter, all the topics in this book dealt with geospatial technology in a two-dimensional format, whether as geospatial data, measurements, maps, or imagery. Chapter 13 began to go beyond two dimensions and start on a third, presenting terrain in a perspective and pseudo-3D view. This chapter looks entirely at presenting geospatial information in three dimensions, as well as designing and visualizing 3D data and concepts.
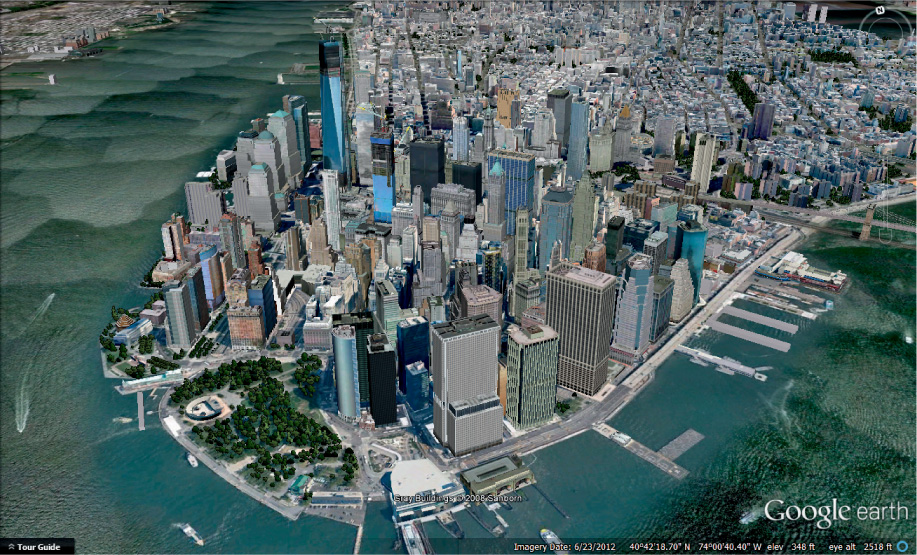
There’s no doubt that 3D visualization of data is impressive—as technology has improved and computers have become faster and more powerful, 3D rendering has become more familiar to us. Video games and simulators are extremely impressive to watch, and computer-animated movies have made huge strides in recent years. While geospatial technologies haven’t (yet) reached the technical level of some of the state of the art CGI we see in some high-budget movies, many 3D modeling and visualization techniques are capable of creating perspective views, 3D maps, and realistic-looking 3D objects. For instance, Bing Maps and Google Earth both support viewing and interacting with 3D geospatial data. See Figure 14.1 for an example of realistic-looking 3D geospatial visualization in Google Earth.
Before proceeding, keep in mind the discussion from Chapter 13 concerning 2.5-dimensional (2.5D) data versus 3-dimensional (3D) data. If only one height value can be assigned to an x/y location, then the data is considered 2.5D, and if multiple z-values can be assigned to an x/y location, then the data is fully 3D (and 3D data also has volume). For ease of reading and usage, this chapter uses the term “3D” throughout to refer to all geospatial phenomena that incorporate a third dimension into their design or visualization, although technically, some examples will be 2.5D or pseudo-3D.
446