14.1 What Is 3D Modeling?
3D modeling designing and visualizing data that contains a third dimension (a z-value) in addition to x- and y-values
z-value the numerical value representing the height of an object
extrusion the extending of a flat object to have a z-value
block a flat polygon that has been extruded to transform it into an object with a z-value
3D modeling (in geospatial terms) refers to the design of spatial data in a three-dimensional (or pseudo-3D) form. Designing a 3D version of the buildings in a city’s downtown district, or a 3D version of the Eiffel Tower, would be examples of 3D modeling of geospatial data. Like all of our spatial data, the 3D models should be georeferenced to take advantage of real-world coordinate systems and measurements. If you’re designing a 3D model of your house, you’ll want to start with a georeferenced base, so that you can make accurate measurements of your house’s footprint. An orthophoto, high-resolution satellite image, or architectural diagram with spatial reference are all good starting points for a georeferenced base to begin modeling from. Digitizing the house’s footprint will give you a polygon (with two dimensions, x and y), but a 3D-style object has to have a third dimension—a z-dimension. This z-value will be the height of the object above whatever surface it’s standing on—in the case of your house, the ground it’s built on.
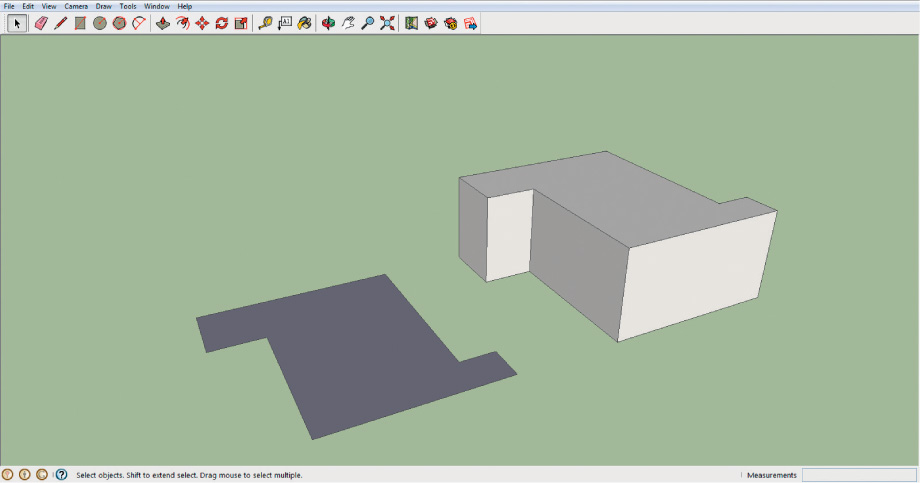
In order to create a 3D version of the polygon, it will have to be extruded to reach the height specified by the z-value. Extrusion is the process of giving height to an object. If your house is 15 feet high, the footprint polygon can be extruded to a height of 15 feet. Extrusion will change the objects—extruding a polygon will transform it into a block. In this case, the building footprint will change into a block 15 feet high (see Figure 14.2 for the comparison between the two-dimensional polygon footprint and the extruded block).
offset a value applied to an object that is not attached to the ground, but is entirely above ground level
Any object can be extruded to a particular height by assigning a z-value to extrude it to. Keep in mind that these items extrude from the ground level up and some objects can’t be designed this way. For example, suppose you want to design a 3D model of a 10-foot-high pedestrian walkway that’s 15 feet over a busy road. If you digitize the bridge’s footprint and extrude it to 10 feet, it will look like a wall blocking the road rather than a bridge over it. To get around this, you’ll have to apply an offset, or a z-value, where the initial object is placed, before you do the extrusion. In this case, the digitized polygon representing the bridge will have to be offset to a height of 15 feet (its height from the ground as it crosses over the road), then extruded to a height of 10 feet (to capture the dimensions of the walkway). Figure 14.3 illustrates the difference between a regular extruded block and an extruded block that has been offset from the surface.
447
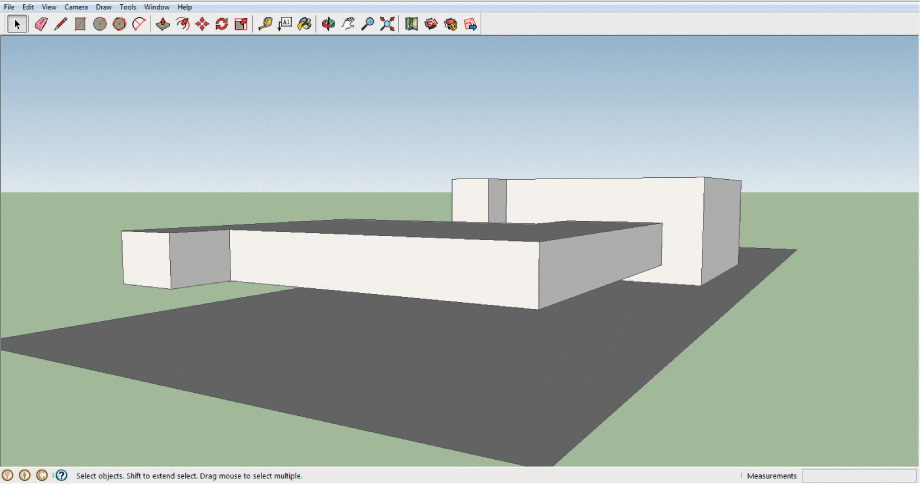
A building being modeled will likely consist of multiple blocks (or other shapes), each representing a different portion of the building. Multiple levels of a house, or differently sized parts of a building, can each be represented by blocks. Just as a GIS dataset can consist of multiple polygons, a 3D representation can consist of multiple extruded shapes and blocks (see Figure 14.4). Each of these blocks can then be treated as its own object for further modeling.
448
base heights the elevation values assigned to the terrain upon which the objects will be placed
In 3D modeling it’s not enough just to place an object in its correctly georeferenced location—it must also conform correctly to the real-world terrain and to real-world elevations. If your house is located 900 feet above sea level, you don’t want to base your house at a ground level of zero feet. If you do, your house will be shown not on Earth’s surface, but 900 feet underground when you merge your 3D model with other geospatial data. Terrain modeling was discussed back in Chapter 13, but the key element to remember with 3D modeling is the concept of base heights (to use Esri terminology). These values represent the elevation of the terrain above a vertical datum.
When you’re designing a 3D object (like a model of your house) that you intend to place on an area of the terrain, you should make sure that the terrain’s base heights are applied to the object you’re designing. In this way, the software will understand that the base of your house begins at an elevation of 900 feet, and extruding your house’s footprint to a height of 15 feet high means its roof top will be 915 feet above sea level, rather than 15 feet above ground level (zero feet). Many geospatial software packages enable the user to combine 3D modeling techniques with terrain modeling to help with the design of more realistic 3D visualizations (some specific programs that do this are described later in this chapter).
face one of the sides of a block
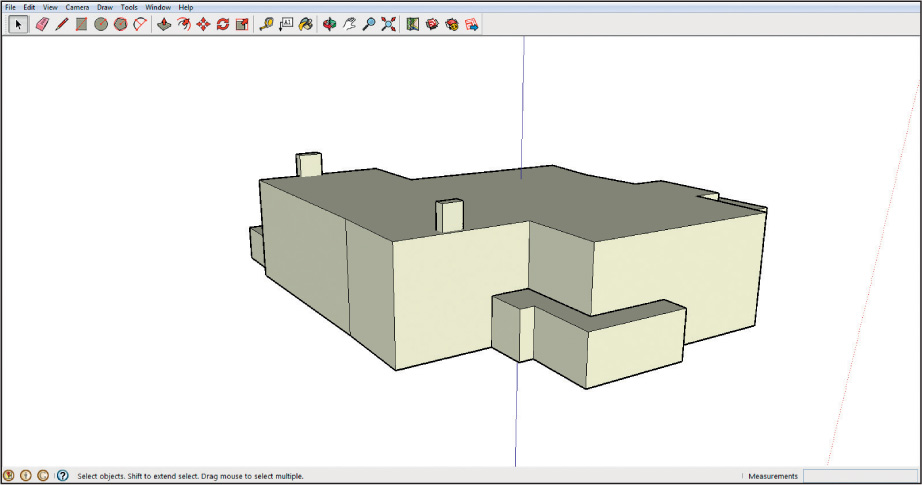
Once the footprints and elevations are correctly set in place, it’s time to start making those gray blocks look like the thing you’re trying to model. Every block has several faces, each face representing one side of the object. For example, an extruded rectangular block will have six faces: top, bottom, and four sides. Each face can be “painted” to give it a more realistic appearance. This “painting” can take a variety of forms—doing something as simple as changing the color of one face to, say, yellow (thus repainting one side of your house to make it yellow) can make a considerable difference to its appearance.
449
textures graphics applied to 3D objects to give them a more realistic appearance
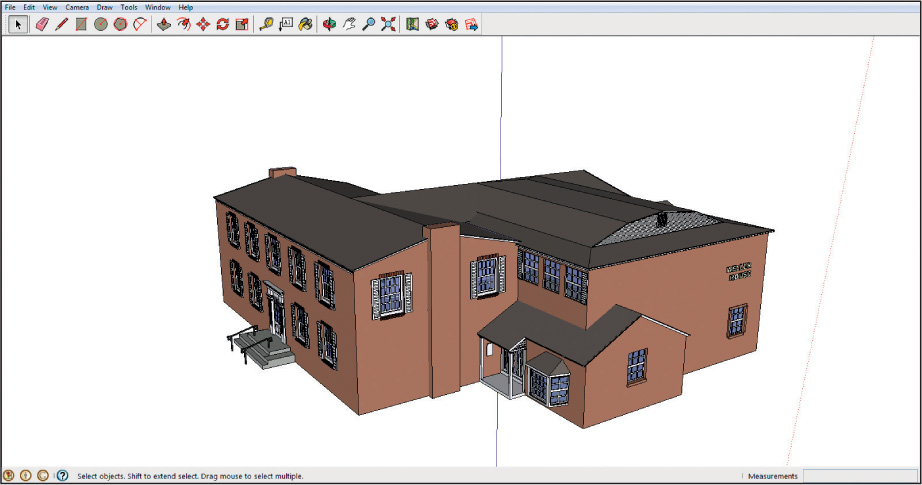
More realistic appearances can be achieved by applying a texture to a face. A texture is a graphic designed to simulate the appearance of materials (like brick, wood, stone, glass, etc.). With textures, you don’t have to draw individual bricks on the side of a building—you just apply a red-brick texture and the face’s appearance is changed: one side of your house is built with red bricks. Similarly, windows can be designed by applying a translucent texture to a window shape drawn onto a face, and various roofing materials can be applied to the faces that make up the roof of your house (see Figure 14.5 for an example of a 3D building with various textures applied to the block faces).
Since a texture is just a graphic, it’s possible to apply other graphics to a face. For instance, you could take a digital camera picture of your home’s particular brick and apply it to a face of your model. If it’s accuracy you want, you might even take a picture of an entire side of your house, resize it, and “paste” that image onto the corresponding entire face of your model. However, it’s not just buildings and objects that can be visualized using 3D modeling techniques. 3D maps can also quickly communicate spatial information to the viewer.
!search! THINKING CRITICALLY WITH GEOSPATIAL TECHNOLOGY 14.1
What’s the Advantage of Using 3D Design?
The use of 3D visualization has become increasingly widespread as a means of viewing and using geospatial data. As processors have gotten faster, and graphics and animation have improved, it’s become easier than ever to render large amounts of geospatial data in realistic 3D form. Why is visualization of geospatial data so critical to conveying a message to the user or viewer of the data? Beyond the “cool” factor, what makes 3D visualization a better conveyor of data than a simple 2D map? What advantages does 3D visualization have over regular 2D for the presentation of data and communication of geospatial information?
450