14.4 How Can Geospatial Data Be Visualized in 3D?
Even with all of these great 3D modeling and design programs, when their products are being viewed they’re still only being seen in a two-dimensional environment on a computer screen. It’s one thing to view a 2D choropleth map (like in Chapter 7), another thing to create a pseudo-3D representation of the mapped data (like a prism map), and another thing altogether to be able to interact with the data in an immersive environment. Examining a realistic geospatial landscape and flying across it (like in Chapter 13) is very neat, but what if you could simulate the full 3D effect of diving through canyons or banking over ridgelines? As computers get faster and develop the ability to handle geospatial data more quickly and easily, new methods of visualizing data are being developed. Immersive “virtual reality” technology allows you to actually become part of the data, moving with the landscape, having yourself placed inside a structure, or being able to move and see on the surface of the map. This sense of immersion, or interactivity, with geospatial data adds immensely to our understanding of the nature of spatial data, whether we are researchers or students.
Another way of making geospatial data appear more realistic (and adding a sense of depth and immersion) is to view the data in stereo. Stereo imagery shows two images (for instance, two images of the same landscape), rendered apart from each other. When you look at something, your eyes are seeing the same thing from two slightly different points of view—which is why you see depth and distance (and view the real world in three dimensions). Stereo images use a similar principle: they are two representations of the same thing, taken from two slightly different positions of the camera or sensor. Remote sensing has long been making use of stereo imagery for measuring the heights and depths of areas. Overlapping aerial photography and images acquired from sensors (such as those onboard SPOT 5 or the ASTER or MISR sensors on Terra) can be used for creating stereo data.
460
anaglyph a new image created by slightly offsetting the features in an existing image from each other and highlighting them in two different colors
stereoscopic 3D an effect that creates the illusion of depth or immersion in an image by utilizing stereo imaging techniques
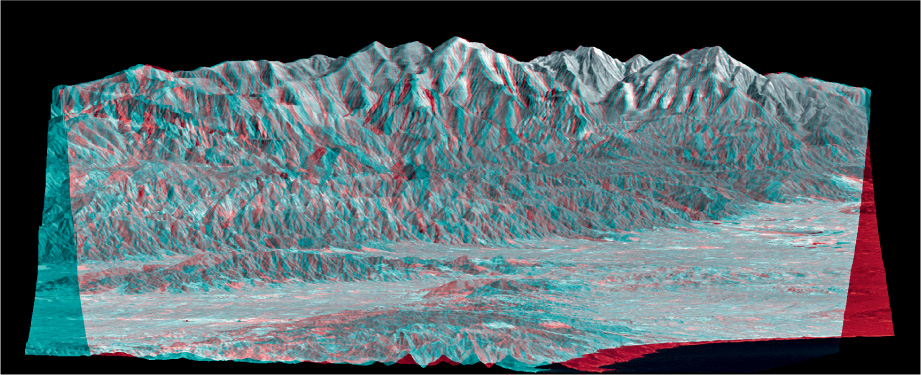
A simple way of viewing imagery or data in stereo (which several geospatial software programs have the capability for) is to create a red and blue anaglyph of the data—in which the two images are slightly separated, but one is highlighted in red and the other in blue. By wearing a pair of 3D glasses with colored gels for lenses, (one red and one blue), the anaglyph images appear to be raised or elevated off the screen in a “3D effect” (see Figure 14.14). This type of stereo effect (where one eye views the red and the other eye views the blue) creates a type of stereoscopic 3D that gives the illusion of depth in parts of the image. Some items may appear in the foreground and others in the background. Red and blue anaglyphs are certainly nothing new, but today, when stereoscopic 3D movies have become all the rage (and the top-grossing film of all time being one of them), there are more high-tech ways of using these stereo concepts with geospatial technology.
GeoWall a powerful computer tool for displaying data and imagery in stereoscopic 3D
If you go to a 3D movie today, you’re not going to be wearing red and blue lenses, but rather a pair of polarized glasses. The same type of 3D glasses can be used with the GeoWall, a computer tool that’s used for examining imagery in an immersive three-dimensional environment with stereoscopic 3D viewing techniques. First developed by the members of the GeoWall Consortium in 2001, it has spread to more than 400 systems, which have been developed for use in schools and colleges (along with places like the EROS Data Center and NASA’s Jet Propulsion Laboratory). The GeoWall can be used for viewing geospatial data in a stereoscopic 3D format.
461
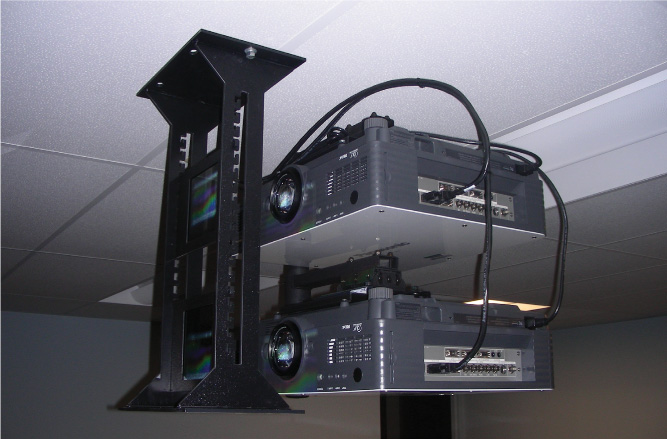
The GeoWall consists of several components that can be purchased separately, to keep the cost of the whole setup affordable (around $10,000). First, two high-power Digital Light Processing (DLP) projectors project the two images that are necessary for stereo viewing. These projectors are hooked into a powerful computer with a dual-output video card (so that the computer can send its output into both of the projectors). The images are projected through special filters in front of the projectors’ lenses, which polarize the light. The light is projected onto a special screen made of material that preserves the integrity of the polarized light (rather than scattering it). Lastly, the user wears a pair of polarized 3D glasses to view the imagery. See Figure 14.15 for the components of the GeoWall projectors and their filters.
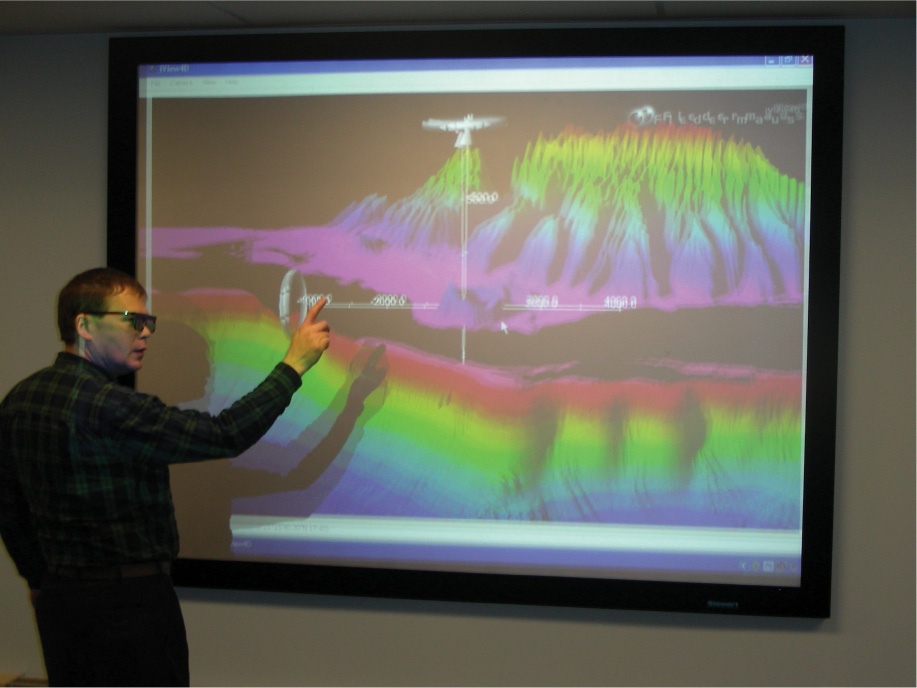
Wearing the 3D glasses, the viewer perceives the images in a 3D effect as if the items and images are appearing off the screen—similar to the effect created by a stereoscopic 3D movie. Viewing and interacting with imagery like this gives the viewer a sense of depth or immersion, as some items will be in the foreground of the image and some will be in the background. Figure 14.16 shows an image of a GeoWall in operation, from the point of view of an outsider who is not wearing the polarized glasses (without the glasses, the images appear blurry and slightly askew from one another). GeoWall viewers position themselves in front of the screen, and are able to see the images projected in stereoscopic 3D.
Using the GeoWall for visualizing geospatial data carries a lot of benefits. The GeoWall enables the viewer to see maps draped over a surface model, or terrain data displayed in stereoscopic 3D. Certainly, being able to dive inside a meteor crater or view volcanic features, coastlines, or river valleys in a stereoscopic 3D environment allows the viewer to get a realistic sense of the terrain features. 3D cities in Google Earth, landscapes, geologic processes, draped satellite imagery, draped topographic maps, stereoscopic photos, and tours of virtual environments are all ways of viewing types of data with a GeoWall setup.
462