Working With Digital Geospatial Data and GIS
109
Geographic Information Systems, Modeling the Real World,
Vector Data and Raster Data, Attribute Data, Joining Tables,
Metadata, Esri, ArcGIS, and QGIS
Once you’ve measured and collected your geospatial data, it’s time to do something useful with it. The nature of geospatial data lends itself to projects like analyzing where one location lies in relation to another, or the appeals of one location versus another. When a new library is to be built, it should be placed at the optimal location to serve the greatest number of people without duplicating the function of other libraries in the area. When a company is deciding where to open a new retail store, they’ll need information about the location—the city, the town, the neighborhood, the block, who lives there, why, and how many. When a family is planning its vacation to Florida, they’ll want to know the best way to get there and the best places to stay, not too far from the theme parks they’re planning to visit. All of these concepts involve the nature of geospatial data and the ability to analyze or compare particular locations and their particular attributes. Geospatial technology is used to address these ideas and solve these types of problems (and many, many more). Whenever examination, manipulation, or analysis of geospatial data is involved (for instance, if you need to tie non-spatial data to a location or if you want to use this information to create a map of your analysis), geographic information systems (GIS) are essential to getting these tasks done.
geographic information system (GIS) a computer-based set of hardware and software used to capture, analyze, manipulate, and visualize geospatial information
GIS is a powerful tool for analyzing geospatial data (the “geographic information” of the title). This ability explicitly to utilize geospatial data is what separates GIS from other information systems or methods of analysis. For instance, a spreadsheet enables you to tabulate housing values and the amount of money paid for a house at a particular address, but even though you’re using data that has something to do with a location, there’s nothing in the spreadsheet that allows you to examine that data in a spatial context (such as translating the housing values into a map of where these houses are).
110
The ability to map the real-world locations of the houses, to examine in spatial terms trends in housing values, and to search for significant patterns or clusters in the geospatial data are what makes GIS unique. Using the coordinate and measurement concepts discussed in the previous chapters allows us to create, map, and analyze digital geospatial data in a wide variety of geospatial technology applications (see Figure 5.1 and Hands-on Application 5.1: Using GIS Online for an example of GIS data used by a county government).
!geo! HANDS-ON APPLICATION 5.1
Using GIS Online
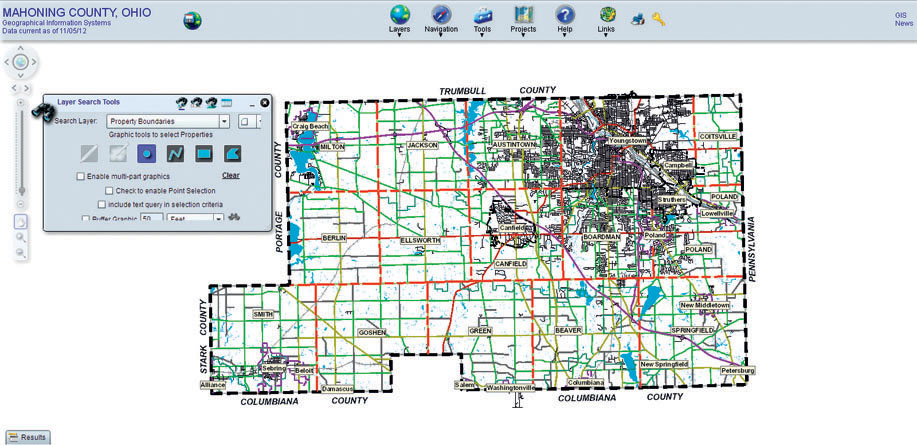
There are numerous online GIS resources for viewing and analyzing geospatial data. An example of a local GIS is from Mahoning County, Ohio. Open your Web browser and go to http://gis.mahoningcountyoh.gov/mahoningpublicviewer. Under the Layers icon, select the option for Layer Search Tools. Use Property Boundaries as the Search Layer, PARCEL ID as the Search Layer field, and look for 29-042-0-002.00-0 (this is the parcel number for the Boardman Township Park). The map will zoom to the parcel of the park and a pop-up will appear with attribute information about that parcel (such as the sale date, acreage, and land value).
Next, under the Layers icon, select the option for Map Layers. Here, you can select which GIS layers are to be displayed on the map. Place a checkmark in the box of the most recent date for Orthophoto to look at overhead aerial photography of the area. You can use the mouse wheel or the options under the Navigation icon to zoom in and out of the view and get a closer look at the map and the surroundings of the park.
Expansion Questions:

Question
GTUgISqenYoh5Ijzikq4h2r1VmBQ1HvIV6rfGo07XSMXZR9xCUEDUhht1pRbmckupps5QVmPilQCji67hsueTSISHui0b/Z4q8ozbRMiwZkzzx0yksE/zJc1MJHsRqS7zGZZjRcm6KDS/yHNZrVlLeggbz/LgzsOrUtZHuHmjNpvtbeMP8OSWp9UVAHQyuof-
Question
mtFI2xX+JPBzM762x6fY1pXXMTE3dnZcc6P0i6/P836mA6RFoRzKVvRTRmRA2LN7226FrOES0YeNwKHhqphWxA== -
Question
x4gwEzJULiR/8frPzfopqDUSO+9UibHsZtGCDl2+a7kMvNukgLIpMESy8mTMBDbhvq7J4rb0dk37CdzburRre+kxSktBi19Xwh/i3mSuSzBS1ODTpkUSgh2MjF1ERiNfdR7zxbISj0CvQDCtihd84RnAO+Xy7xApBWSxiSbGHjtYZY42b1lK/fuJApHY+WzV7vCCBEiwallUqIDXjLwiiT6UOrIRKgTrvy0KK+yiSWA10e8z3VN6tSQ3ehGauaICjGn1q9zY6i9zn0eFmYl8QaGJLtAupkic/2NDqcIPNfRP28djW60HQVb4G7CorgPDiBNHRHx8e0mb8f0GgXxWr1mBLDpksCtsDQcJK6JvLHfKwx7HtHVOeJHgxqQBcKrjnGOcxECBazptfnXVNEMlYTMqRsfq1Rcv/pkL71fSX3f7Fr6j5Fn+XDyE0hcFjv76xtp84Q==
111
GIS is by its nature 100% computer-based—whether it involves software running on a desktop, laptop, mobile device, or served off the Web, the “system” being referred to is a computer system. The information handled by GIS is geospatial information—something that has direct ties to a location on Earth’s surface. GIS can also utilize non-spatial data and link it directly to a location. For instance, if you have a set of data points that represent the locations of local car washes (that is, geospatial data) and a separate spreadsheet of data of how many cars use a particular car wash (that is, non-spatial data), you can link the usage data in the spreadsheet to the car wash location so that the location contains that data. From there, you can do analyses of local population demographics or road conditions about how they relate to the usage statistics of the car wash at that particular location. This wouldn’t be possible without GIS being able to link non-spatial data to a location. Lastly, GIS can also perform multiple types of operations related to geospatial data—it can be used to analyze, capture, create, manipulate, store, or visualize all manner of geospatial information, not just simply design maps (though it can do that too).
CGIS the Canadian Geographic Information System—a large land inventory system developed in Canada, and the first system of this type to use the name “GIS”
GIS isn’t a development that just popped up over the last couple of years. Large-scale mapping efforts were done using computer-based cartography in the 1950s and 1960s by a number of different government agencies and other labs (including Harvard Laboratory). The term “GIS” first appeared in the early 1960s with the implementation of CGIS (the acronym for the Canadian Geographic Information System), which was designed to provide large-scale mapping of land use in Canada. The development of CGIS is attributed to Roger Tomlinson, who has become known as “the father of GIS.”
GIS developments have continued over the years through the efforts of government agencies and the private sector, and these days GIS technology and concepts are extremely widespread (see Hands-on Application 5.2: ArcGIS Online for another example of using GIS concepts online).