5.2 How Can You Represent the Real World as Continuous Fields?
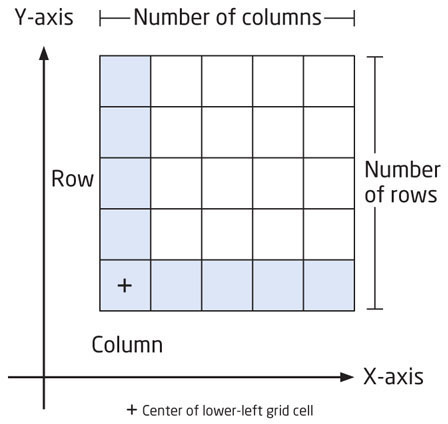
raster data model a way of representing spatial data that utilizes a series of equally spaced and sized grid cells
grid cell a square unit, representing some real-world size, which contains a single value
When these kinds of continuous fields are represented in GIS, the three vector objects (and thus, the vector data model) are often not the best way of representing data. Instead, a different conceptualization called the raster data model is usually used. In the raster data model, data is represented using a set of evenly distributed square grid cells, with each square cell representing the same area on the Earth’s surface (see Figure 5.6 for the layout of the grid cells). For instance, to represent an entire section of the landscape, each grid cell might represent 10 square feet, or 30 square meters, or 1 square kilometer, depending on the grid cell size being used for the model. Regardless of the grid cell size, each cell has the same resolution (that is, the same grid dataset cannot mix cells of 30 square feet together with cells of 5 square feet). Also, each grid cell contains a single value representing the data being modeled. For instance, in an elevation raster, each grid cell could contain a value for the elevation at that area on the ground. Datasets such as land cover, soils, or elevation are all commonly represented using the raster data model.
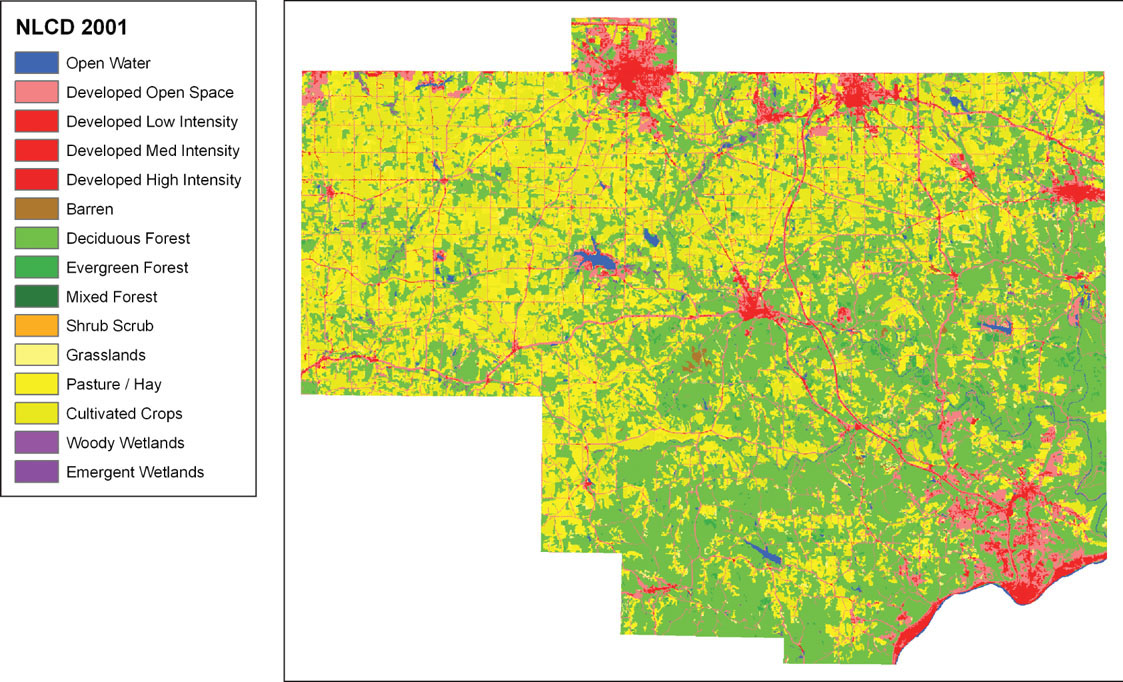
NLCD the National Land Cover Database is a raster-based GIS dataset that maps the land cover types for the entire United States at 30-meter resolution
The National Land Cover Database (NLCD) is an example of a raster dataset used in GIS. Developed by a consortium of United States agencies (including the USGS and the Environmental Protection Agency), NLCD provides 30-meter raster data covering the entire United States, wherein each grid cell is coded with a value that corresponds to a specific land cover type at that location. NLCD designations include categories such as “Open Water,” “Developed, High Intensity,” “Deciduous Forest,” “Pasture/Hay,” and “Woody Wetlands.” NLCD provides a means of broad-scale land cover classification at a state, regional, or national scale (Figure 5.7). NLCD products are available for land cover circa 1992, 2001, and 2006 (with a new dataset in production for 2011 land cover). A separate dataset is available that details the change in land cover types between the 1992 and 2001 datasets, enabling researchers not only to measure land cover types, but also to see how the landscape is changing (like where agricultural fields or forests are converting over to urban land uses). NLCD data is distributed free of charge via Web download in a format that can be easily read or converted by GIS software. See Hands-on Application 5.4: The National Land Cover Database (NLCD) for how to access NLCD data.
118
!geo! HANDS-ON APPLICATION 5.4
The National Land Cover Database (NLCD)
The USGS has an online tool for viewing the 1992, 2001, and 2006 NLCD (and some products derived from them), as well as letting you download sections of the dataset for use in GIS. The viewer is available at http://www.mrlc.gov/viewerjs. The default view will be either the 2001 or 2006 NLCD data. From the Data option on the right side of the screen, you can select different NLCD data to view using the Layer Manager. If you want to download the data, the tools in the viewer will allow you to download the raster datasets directly.
Expansion Questions:

Question
PWCntsybncooZsXmGWsJoRrpycl+qnEwKouQzk5tAbwk8uSTfIulP+xIXlP/DUIHl2tgsRDioAivkpEdjtpeek988oMOy3hxjliVuj6BR01bGIXDuwsOL0txaQ7XY9ExoPUdDo4/caqhgxBhtzv4Vm6VQko6928W4H/nqH0punaWg8ao+wYLercO6e524AaG-
Question
2h3S+G5ZzaPgYukA9HFv7PSAcJEdz6a9shG+J9V5M3jSYq1aC5IgXwzSs8jgsJWrAa2pWHidhIPQ1ipy+pYqLyC0ZO4LJ2um/z1ustmjmUlMR7X0t+DBTZZPWkENerVgzXHMhwg/KCIlMi/n+INHbAB9OQu7FeSvfI+mRqo37SU=
119
Real-world items can be represented in GIS using raster data or vector data, although each data model lends itself to different types of features. For instance, to create a precipitation map of an area, scientists may record rainfall amounts at dozens of different points. A map would then show the rainfall levels only at these scattered locations and these would be best represented with points (vector objects). However, it might be more useful to take that data and create an entire continuous surface that would predict the level of rainfall at all areas in the region, which could then be shown with raster data in which every grid cell would contain the value of the amount of predicted rainfall. However, some objects are best represented with vector data, especially those having a definite boundary (such as building footprints or land parcels) or a fixed starting and ending point (such as a road or power line). No matter how these items are represented in GIS, it’s important to note that both vector and raster data structures are only modeling the spatial features of real-world items—but GIS is also capable of handling all of the non-spatial data that goes along with them.