8.1 Geospatial Lab Application: Geocoding and Shortest Path Analysis: QGIS Version
This chapter’s lab will introduce you to the concepts of calculating a shortest path between stops along a network, as well as generating directions for the path using Google Earth and Google Maps. You’ll also be performing geocoding using a Web service, examining the geocoding results, then performing some basic spatial analysis of the results in relation to a TIGER file using Google Earth and GIS.
As in some of the geospatial lab applications in previous chapters, two versions of this lab will be provided. The first version (Geospatial Lab Application 8.1: Geocoding and Shortest Path Analysis: QGIS Version) uses the free Quantum GIS (QGIS). The second version (Geospatial Lab Application 8.2: Geocoding and Shortest Path Analysis: ArcGIS Version) provides the same activities for use with ArcGIS 10.1 or 10.2.
Objectives
The goals for you to take away from this lab are:
 to familiarize yourself with the shortest path and directions functions of Google Earth.
- to use Google Maps to alter the shortest path to account for route changes.
- to utilize an online geocoding service to geocode a series of addresses, and then examine the results.
- to use the QGIS software to plot the results of a geocoding operation.
- to examine some basic spatial analysis of locations and their relation to a road network (TIGER file) in QGIS.
Obtaining Software
- The current version of Google Earth (7.1) is available for free download at http://earth.google.com.
- The version of QGIS used in this lab is 1.8.0, and available for free download at: http://qgis.org/downloads.
Important note: Software and online resources sometimes change fast. This lab was designed with the most recently available version of the software at the time of writing. However, if the software or Websites have significantly changed between then and now, an updated version of this lab (using the newest versions) is available online at http://www.whfreeman.com/shellito2e.
265
Using Geospatial Technologies
The concepts you’ll be working with in this lab are used in a variety of real-world applications, including:
- emergency services, which utilize geocoding to determine the location of 911 callers, so that the nearest available aid can be quickly dispatched to the right place.
- commercial promotion and postal services, where traveling sales representatives and delivery drivers make use of routing information to take the shortest and most obstacle-free paths between destinations.

Lab Data
Copy the folder Chapter8QGIS—it contains:
- a Microsoft Excel spreadsheet featuring a series of addresses to be geocoded.
- a second Microsoft Excel spreadsheet containing latitude and longitude coordinates for each address.
- a .kmz file containing library locations in a format readable by Google Earth.
- a TIGER 2000 line file in shapefile format, projected into UTM.
Localizing This Lab
The datasets in this lab focus on the locations of public libraries and the road network in Virginia Beach, Virginia. However, this lab can be modified to examine your local area by doing the following:
266
- Use your local county library’s Website (or the phone book) as a source of names and addresses of local libraries, and use Microsoft Excel to create a file like the one in the Chapter8QGIS folder (where each column has a different attribute of data). If there are not enough local libraries around, use the addresses of other local venues, like coffee shops, pizza shops, or drugstores.
- A TIGER file (in shapefile format) of the roads of your county can be downloaded for free from Esri at http://arcdata.esri.com/data/tiger2000/tiger_download.cfm. Unzip the file and the shapefile will be ready to go (this was the source of the Virginia Beach TIGER file used in this lab). Coordinates of the downloaded files are in NAD83 decimal degrees, and the file used in this lab has been projected into NAD83 UTM Zone 18. If you want to use your own local data with UTM, be sure to project it into the proper zone (see Chapter 2 for more about UTM zones).
8.1 Google Earth’s Shortest-Path Functions
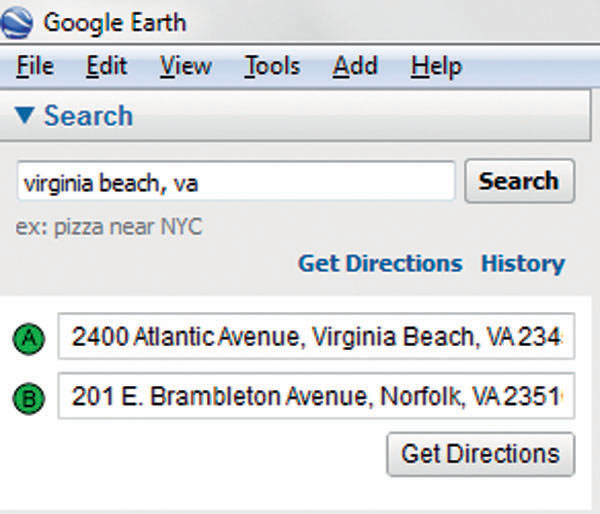
- Start Google Earth (GE) and Search for: Virginia Beach, VA.
- Let’s start with a typical summertime scenario. You’re on vacation in Virginia Beach, visiting the Old Coast Guard Museum (which fronts onto the oceanfront boardwalk). You have tickets to see a show at Norfolk Scope Arena, located in nearby downtown Norfolk. You want to take the shortest route to get from your beachfront location to the arena. Like you did in Geospatial Lab Application 1.1, select the Get Directions link. Use the following addresses for directions:
- A: 2400 Atlantic Avenue, Virginia Beach, VA 23451 (this is the Museum you’re driving from)
- B: 201 E. Brambleton Avenue, Norfolk, VA 23510 (this is the Norfolk Scope you’re driving to)
 (Source: Google)
 - Click the Get Directions button for Google Earth to compute the shortest route between the two points.
- The shortest path will be highlighted in purple.
- Make sure the Roads layer is turned on in the Layers box.
Question 8.1
X1O5837etviboB5tKkuoZrvkaRXSkIIqvmGam5mQvYPLp6ghHRC8yg/MhF6FcFL3Wmf3mBWGgstCUqVfdrEqnUFBmWC7cvrTU7OJ0U7ioM4Fq5WW0nJaSJLLX688r1btFzXWgpTWiiwq5u2uRWaQy/hjuK81PdQmxEr9lVESvxnS9Ruhw/rLJS2KUEV4RiCa+4Ev00GIKqOmomjayg6icw== - The search box will give information about the length of the route.
Question 8.2
u4G2+ALZeTWTik4KQUvGeUZjkGr3mctj1dUWjX62JhyN+hwnVQSv7Vki9SoQ634trmCYIRw0gubjROp1INvnuxlJtCoaXVZk88YuuYo0MeD41N4nrLYMiKcchIA=
8.2 Google Maps’ Shortest-Path Functions
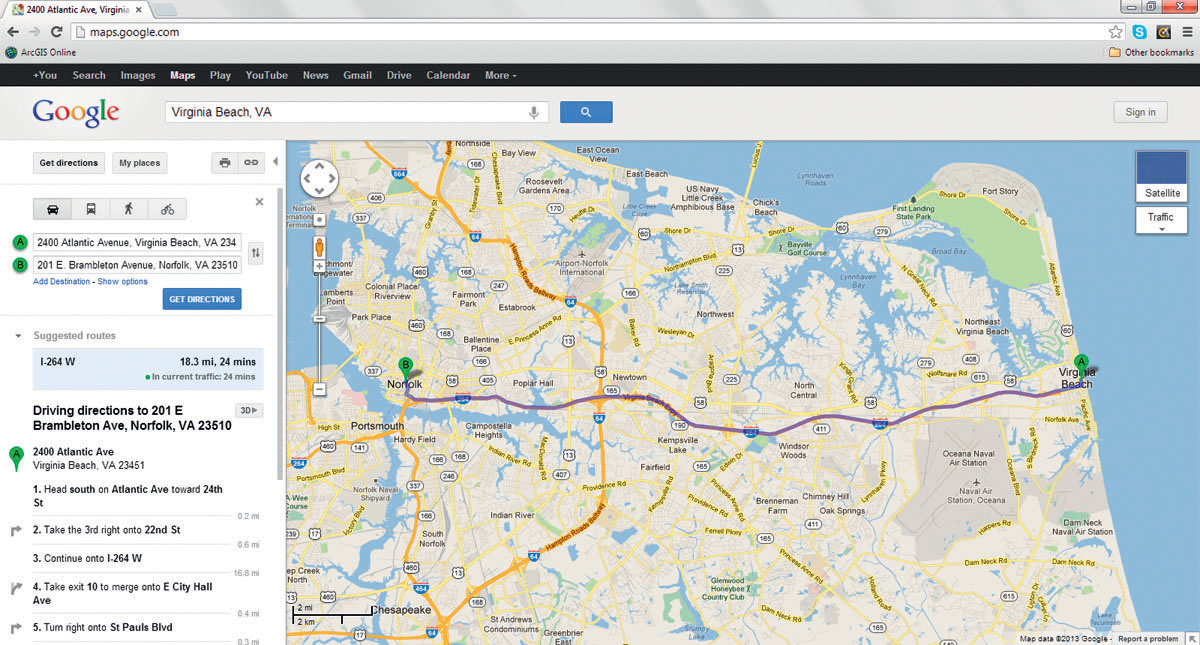
- Keeping in mind the shortest path that Google Earth calculated, open your Web browser and navigate to the Google Maps Website at http://maps.google.com.
- Type Virginia Beach, VA and click the Search button.
- When the map of Virginia Beach appears, select Get Directions and use the Old Coast Guard Museum address for option A and the Norfolk Scope address for option B.
- Select By Car for your method of travel (the car icon) and click on Get Directions.
- The shortest route between the two points will appear, highlighted in purple. It should be the same route that GE calculated for you. It may give an alternate route to take as well.
 (Source: Google)
 - Zoom in closer to the original point A. Scroll the mouse over the purple shortest path line and you’ll see a white circle appear along the path. This lets you change the calculated route to account for any variety of factors (such as travel preference, known congestion or construction areas, rerouting to avoid likely trouble spots or known delays, and so on).
- Start by placing the mouse over the turn onto I-264 and drag the circle up to state route 58 (also known as Laskin Road or Virginia Beach Boulevard—the other major east-west road just above and parallel to I-264). The route will change by first having you drive north on Atlantic Avenue, turning west on 58, then merging back onto I-264 again a little later on the route. Even though it’s a small change, you’ll see that the driving distance and estimated time have changed. Answer Question 8.3. When you’re done, return the circle back to its original starting point and the route will go back to how it originally was.
Question 8.3
A870lmyizUln0Mu/TGYcDyzf4r6V4lj2zqhIGiI5fOtlcJ2dPEJKPKQbwFQKOCjrjlALJygpCj8jzaV/G7TYftpgf8xS7helTMplhzkegIeZUWGwKUz1WndedqOM0T/mfgS3ohBho5y3of+JzTcZoIoIgh0RJpbJ - Scroll across the map until you see where the route crossed I-64 (about two-thirds of the way between the two points). I-64 is the major highway into the Hampton Roads area. Let’s throw another change into the scenario—say, for instance, that there’s heavy construction on I-264 west of the I-64 intersection. At the intersection, move the circle off the route and north onto I-64 far enough that the remainder of the route to Norfolk Scope diverts your shortest path headed north onto I-64, and not so that it returns you to I-264 west (you may have to move other circles as well if Google Maps diverts your path back onto I-264).
Question 8.4
Cw5st5KssoLvSGYaB+W0MbY+5zcBZtNw/mtN881OvPDav0jZa/FJeqO7QOhBZcU7/IdYoE+LAdFRTTWnDr91mUgGy7ZQsVLCXzja7Pbq3EZpCQUp2LzM52+UNtQ=Question 8.5
u+VzLJ3u9dUwt/Ec+afeKLFIRbXokBIyUF2HXjv3D/b0SiFT5ZqF4/8VYzkVr3MWSnYJuYbmDOG3cvweF6GqIe0KSaYJXPVzJyvbMrTqJdQHCPt1FY4u4t3UN5dswKzsAQlsnbrNqk3iwkvlFR73TQ6rV0Twb+9SxVCuY/r0F3YF3jiCupEROvi2UoheCfG0evDxylRA1Xeins7Qin91OBSF2tCZl2ewBZMl8QyGtfrKOJPqPg+r3XX5amBnEATWTrN1K4qve0xUREowM0pb6y3Xd5MbwShMESORz6+basOW2acl6jWJnXD+xndw0uDe - Reset the route back to its original state. Now, change the route so you would have to travel south on I-64 instead of north (still avoiding I-264).
Question 8.6
Cw5st5KssoLvSGYaB+W0MbY+5zcBZtNw/mtN881OvPDav0jZa/FJeqO7QOhBZcU7/IdYoE+LAdFRTTWnDr91mUgGy7ZQsVLCXzja7Pbq3EZpCQUp2LzM52+UNtQ=Question 8.7
z3cEYWS1KR1i2TJDUnHFbEcA6UsauhSmJuCZ122B2j68Zw7NaqAKtsB0/8ghyBJqU68nJ3KdHHL+fBbJOO/tssuckF+2Y+FIznsJYkJBB9+BF2DfgtTJxWswh6XMPOhiHgXA+PYLf0kRLD/e7/B35Ks2xF4MYLp3s84SXzFC0gMAuN2so2MfnVAk5gOXOjYrX4CKzoE2hMs4bIgzAoO+ZciwKKjW0801zDuQRCakqlH+Z/gvHc5l69ugllc= - All of these options can be used to model alternative routes, avoid potential barriers, or exercise user-defined choices during shortest-path calculations. Each of these routes is a “best route,” just based on the parameters (such as simulating barriers) given to the system.
269
8.3 Geocoding and Google Earth
Before any type of shortest path could be calculated, the system first had to match the addresses of the starting and ending points to their proper location. The next section of this lab will introduce a method of doing this address matching (geocoding) to create a new point layer for use.
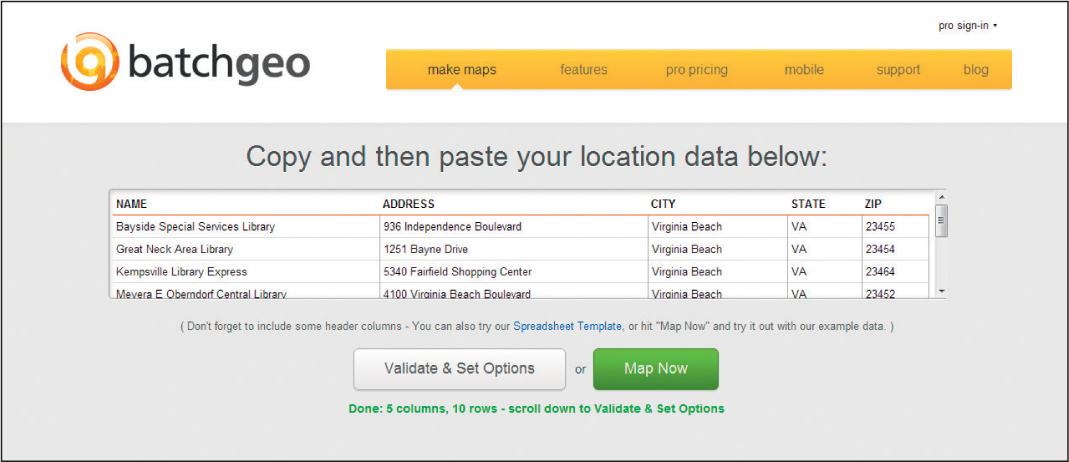
- Open a new tab or window with your Web browser and go to the URL http://batchgeo.com.
Important note: BatchGeo is a free online tool that will let you match multiple (or single) addresses to their road-network locations and create a point layer marking each of those address locations. In this portion of the lab, you’ll still be working with the Virginia Beach area, focusing on the locations of the city’s public libraries. - Open the VBLibraries file in the Chapter8QGIS folder (it’s in Microsoft Excel format). This lists the names and addresses of ten different public libraries in Virginia Beach.
- Use the mouse to select all rows and columns in the Excel file that contain data in them (including the column headers like “Name,” “Address,” and so on). Copy this data.
- On the BatchGeo Website, click the mouse in the “Copy and then paste your location data below” box to select all of the data listed in it, and delete it. Then paste the data from the Excel file in place of it. The box will now show all of the data from the Excel file, but it will be separated by large spaces.
- Click on the Validate & Set Options button. This will ensure that the data is properly in the format that batchgeo.com needs it to be in. If an error message comes up, delete the information in the box, then re-copy and paste the Excel data.
 (Source: BatchGeo)
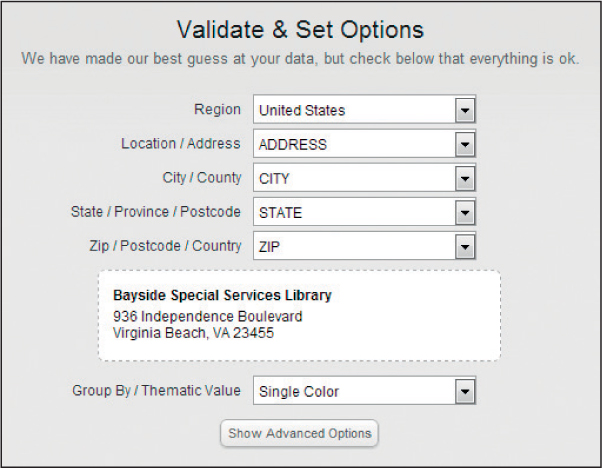
 - Next, BatchGeo needs the names of the fields to be identified for it to begin the geocoding process (in other words, it wants to know which column contains the Address data, which column contains the Zip Code data, and so on).
 (Source: BatchGeo)
 - Make sure the following fields are selected:
- Location / Address – should be ADDRESS
- City / County – should be CITY
- State/ Province / Postcode – should be STATE
- Zip / Postcode / Country – should be ZIP
- All other fields can stay at their defaults.
- Lastly, click on the green Make Map button.
- You’ll see a Google Map generated of Virginia Beach that contains symbols indicating the libraries’ locations. This means the geocoding process is complete.
- Pan and Zoom around the map to get a feel for where the libraries have been geocoded to. If you want, you can save this map for your own use. However, at the time of this writing, you can’t access any coordinate data for the points or download a Google Earth compatible file. In order to get both of these things, you’ll use a different Web resource.
- Open your Web browser and navigate to http://www.gpsvisualizer.com/geocoding.html.
- On the Website, click the link for Geocode multiple addresses. A new Web interface will appear.
- Return to Excel and re-copy all of the data, including the headers for each column.
- Back on the GPS Visualizer Website, paste all of the Excel data in the Input box.
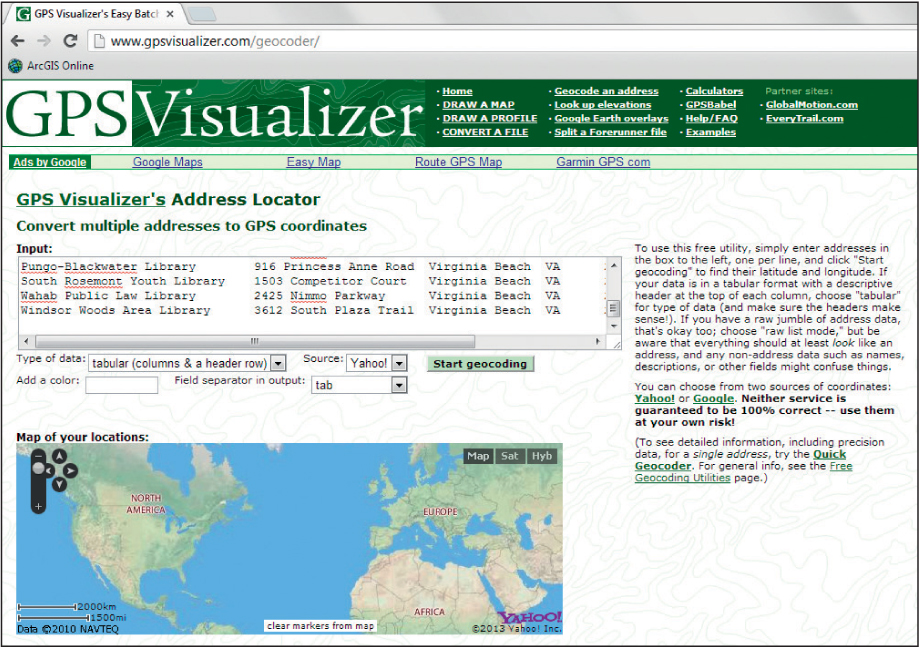 (Source: GPSvisualizer, NAVTEQ, Yahoo)
 - For the various settings, use the following:
- For Type of data, choose tabular (columns & header row).
- For Source, choose Yahoo!.
- For Fieldseparator in output, choose tab.
- When the settings are correct, press the Start geocoding button.
- The “Results as Text” box will fill in with the results of the geocoding process.
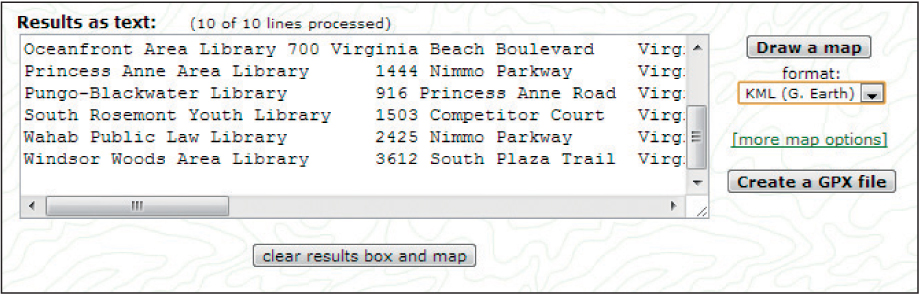 (Source: GPSvisualizer, NAVTEQ, Yahoo)
 - In the format pull-down menu under the “Draw a map” button, select KML (G. Earth). This will enable the GPS Visualizer Website to create a file of the geocoded addresses that is compatible with Google Earth.
- After choosing that option, click on the Draw a map button.
- A new Web page will open and a blue and white “KMZ” icon will be shown with a link next to it (the link will be a string of numbers ending in the letters .kmz).
272
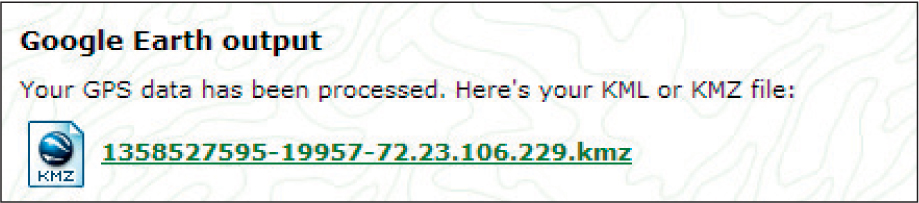 (Source: GPSvisualizer)
 - Click on the link and if prompted choose to Open With Google Earth. Click OK in the dialog box.
- Also, do NOT close the browser window with the geocoded data. We’ll return to it later in the lab.
- In the Places box, there should be a new heading for Temporary Places, and under that should be a new checkbox for a .kmz file called GPS data. Turning this option on and off will toggle the display of the points representing your geocoded libraries. Basically, the GPS Visualizer Website converted the geocoded locations into a file that could be read by Google Earth. Note that a copy of this GPS data .kmz file is included with the Chapter8QGIS folder, just in case you’re unable to access the Web resources that were used to generate it.
- Once the geocoded results are added to Google Earth, in the Google Earth view you’ll see each of the libraries represented by a point.
- To make your layer easier to see, right-click on the GPS data file and select Properties. Under the Style, Color tab you can alter the color and size of both the icons and their labels.
- Rolling the mouse over the top of a point will display its name. Clicking on a point will open a box with its name and address. Right-clicking on a point will allow you to access options for Directions to be calculated to that point or from that point.
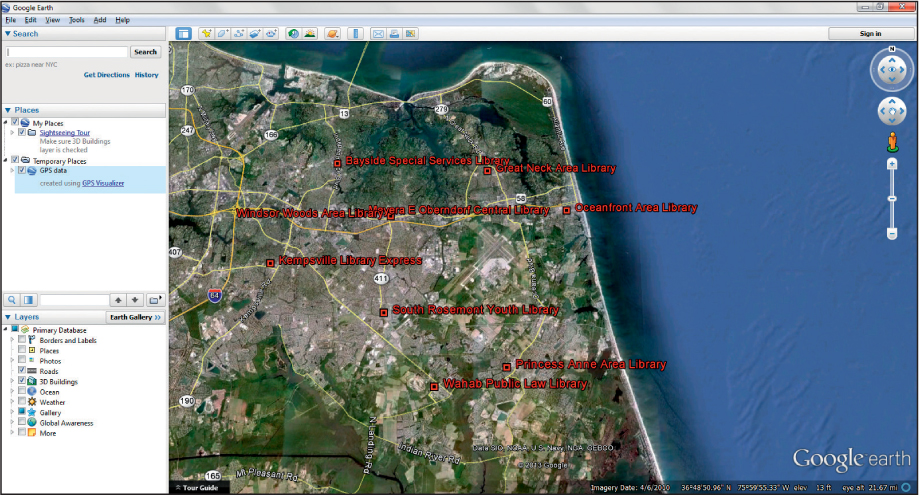 (Source: Google, SIO, NOAA, U.S. Navy, NGA, GEBCO)
 - Select the Great Neck Area Library, right-click on it, and select the directions from here option.
- In the Search box, you’ll see the Search option switch to say “Great Neck Area Library” with its latitude and longitude.
- Next, locate the Princess Anne Area Library, right-click on it, and select the directions to here option.
- In the Search box, the information about the new Princess Anne destination will be added. A new shortest path from the Great Neck Area Library to the Princess Anne Area Library will be calculated and displayed in purple.
Question 8.8
B4HXGD/PtlR0mxNyeZ3v0poCKh7pgCMrr/yjL0GYL4kh1xH0OSDL16NnJ6gAYwR4xB/Bpl21d0EU4IBS4SYAHQFt2/jAyCADkrGlfyzFez9qMLCsMSriamQWmwFCGm3JnxOsZAuceJBykhsnOcT5F6BpZ+43VKx2gM0F5MaPOCQzZuEJ7/L+iuSmeLU= - Locate both the South Rosemont Youth Library and the Oceanfront Area Library.
Question 8.9
Pg4WDezC+qHmBtfOZD4hnzWIyr2f4QpYa/rGDX5uMWx/PS8IdsczMti3kgCcNzt0kkXwLfqxbgkHhA0DqtS8HCnjBOVnKcXsdqVd2x4ULUlfDFnQTHe6qILFQIuq0kjHMC3HdR6l3+l3hZlxNMFMsfWZTZsnVF3iUQA6OqY3IKyp7YZ8ivpoKfy1X9Q=
8.4 Preparing Geocoded Results for GIS Analysis
The next step of the lab will investigate how to use the GIS road files (like a TIGER file) and these geocoded results in GIS.
Important note: ArcGIS has full geocoding capabilities, allowing you to start with a table of addresses and create a point layer from them (without having to use a Website to perform the geocoding), but the free QGIS does not. However, you can use the results from the GPS Visualizer Website with QGIS by converting the address points into latitude/longitude coordinates and mapping those as points in QGIS. The GPS Visualizer Website may report back the latitude and longitude coordinates for all geocoded points. If so, it’s easy enough to copy the full contents of the “Results as text” box into an Excel spreadsheet. You will then have the addresses and their coordinates together in a file. Also, the latitude and longitude coordinates for each point are stored in the .kmz file you loaded into Google Earth.
- Return to Google Earth, right-click on the GPS data .kmz file, and select Copy.
- Open a text editor utility like Notepad (in the Accessories folder in Windows), and Paste the .kmz file there.
You’ll see the code that makes up the file, including the latitude and longitude coordinates for each geocoded point. You could make two new columns in the original Excel table—one for latitude and one for longitude—and copy and paste the coordinate information for each one into its proper place in the table. It’s a longer way of doing things, but in the end you’ll have coordinates for each geocoded address available.
274
For the purposes of this lab, a separate Excel file called VBCoords is available within the Chapter8QGIS folder that has all of this done for you.
Important note: The latitude and longitude computed by gpsvisualizer.com are decimal degree values.
8.5 Plotting Geocoded Results in QGIS
- Open the VBCoords.xlsx file in Excel. Use Excel’s Save As option to save the file not as a regular Excel file, but as a Tab Delimited (text) file (in Excel 2010, this is the option for Text (Tab Delimited) under the “Save As Type” options in Save As). Call this new file GISlibraries.txt and save it on your computer in the Chapter8QGIS folder (note that if Excel gives a warning about the Save As process, that’s fine – just click OK and continue with the process).
- GISlibraries.txt now contains all the library address information, plus a latitude and longitude location value for each library. This information will be used to plot their locations in QGIS.
- Start QGIS. From the Chapter8QGIS folder, add the tgr51810lkaUTM.shp shapefile to the map (see Geospatial Lab Application 5.1 for the basics of starting QGIS and adding data to it). This shapefile is a TIGER 2000 file of the Virginia Beach road network projected for you into UTM.
- Open the TIGER file’s attribute table. You’ll see it contains 19,026 records, each representing a link of the city’s road network. You’ll also see the standard TIGER file information of address ranges, census feature class codes, and so on assigned to each link. You can close the attribute table for now.
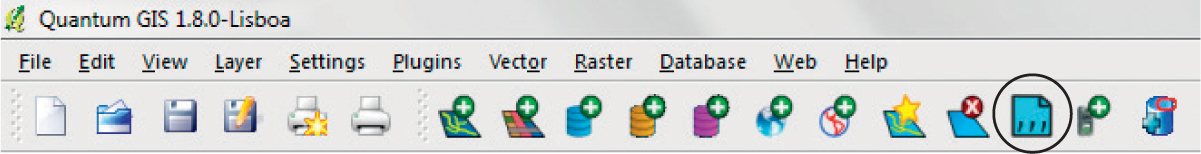
- In this next step, you’ll create a new layer of points from the latitude and longitude coordinates for each library. To begin, click on the Add Delimited Text button on the toolbar:
 (Source: QGIS)
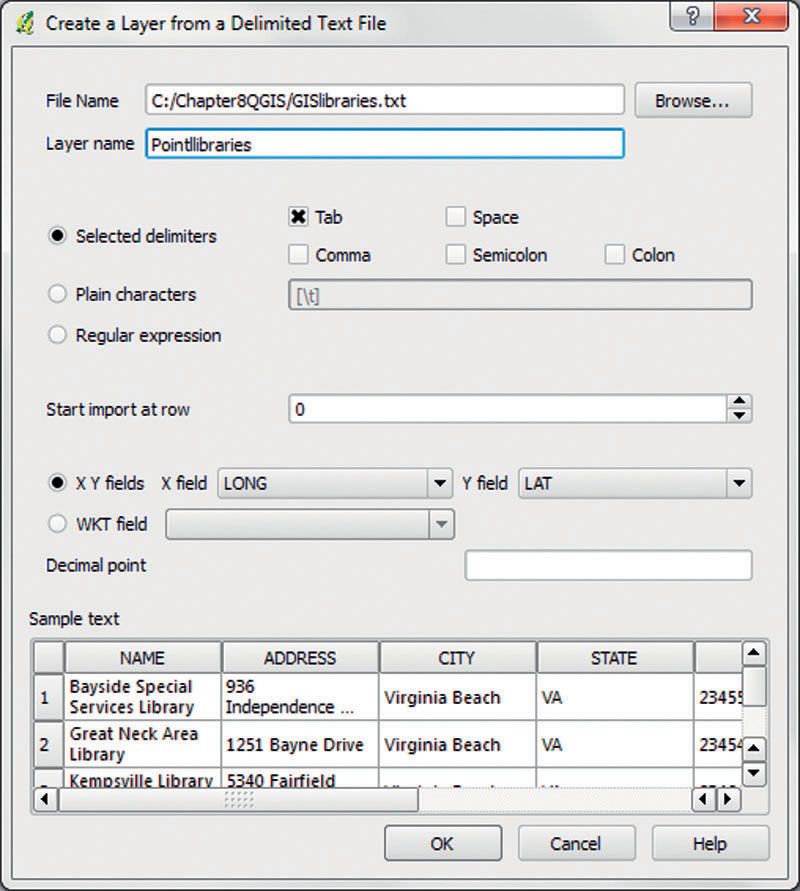
 - The dialog box will appear. This will enable you to create a layer from a delimited text file (such as the GISlibraries.txt file you saved from Excel).
275
 (Source: QGIS)
 - Browse to the GISlibraries.txt file for the File Name (QGIS will use this as the source of the latitude/longitude values).
- Type Pointlibraries for the Layer name (this is what the new point layer created from the coordinates will be called).
- Select the radio button for Selected Delimiters.
- Put a checkmark in the option for Tab (and remove any checkmarks from any of the other delimiting options if they are there, such as Comma or Space).
- Use 0 for Start import at row.
- Select the radio button for X Y fields.
- Select LONG for the X Field.
- Select LAT for the Y Field.
- Click OK when all settings are ready.
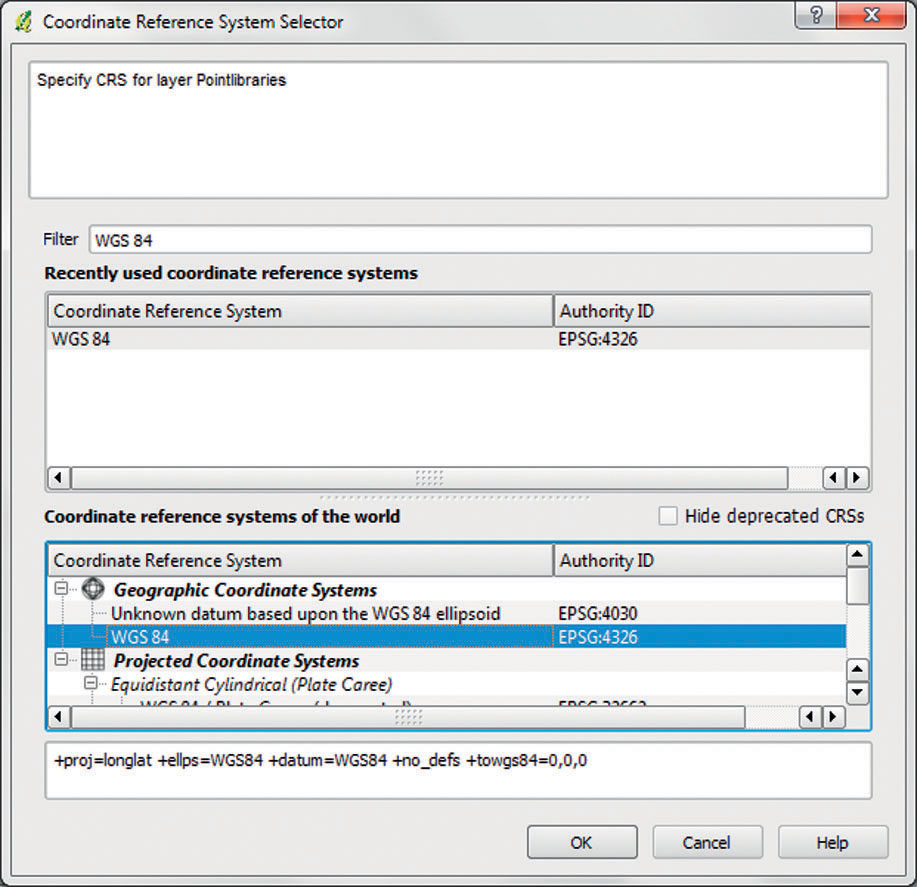
- A new dialog (the Coordinate Reference System Selector) will appear so that you can tell QGIS what coordinate system, datum, and projection these latitude and longitude coordinates coincide with.
 (Source: QGIS)
 - In the Filter option, type WGS 84 (note that there is a space between “WGS” and “84.”
- In the options for Coordinate reference systems of the world, choose the WGS 84 option under the Geographic Coordinate System options (this will be the WGS84 option with the EPSG:4326 designation).
- Click on OK to complete the process.
- A new point layer will be created (called Pointlibraries) and added to the Map Legend.
- You’ll see that no points are appearing on the Map View along with the road segments from the TIGER file. Since the TIGER file is projected in NAD83 UTM and the points are derived from WGS84 GCS, you’ll have to change the projection of the points to match the road network.
- To do this, right-click on the Pointlibraries layer and select Save As…
277
 (Source: QGIS)
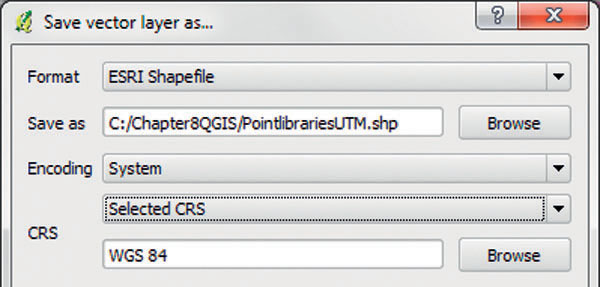
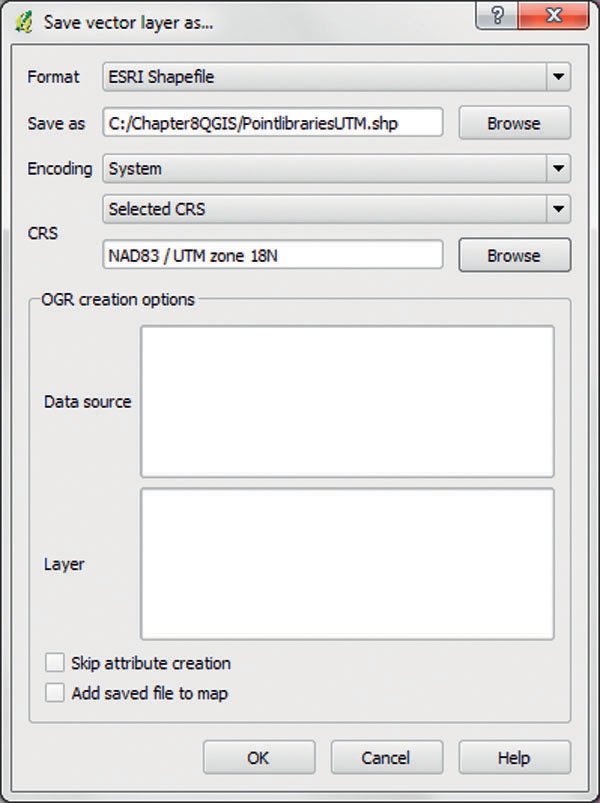
 - In the Save vector layer as …. dialog, choose ESRI Shapefile for the Format (since you’ll be saving this layer as a shapefile).
- Browse to the Chapter8QGIS folder and name the new shapefile you’ll be creating PointlibrariesUTM.shp.
- For Encoding, select System.
- For CRS, choose Selected CRS. At this point, the coordinate system and projection assigned to the layer is WGS84. You’ll want to change this to UTM (and use Zone 18, since that’s which UTM zone Virginia Beach is in). Click on the Browse button.
 (Source: QGIS)
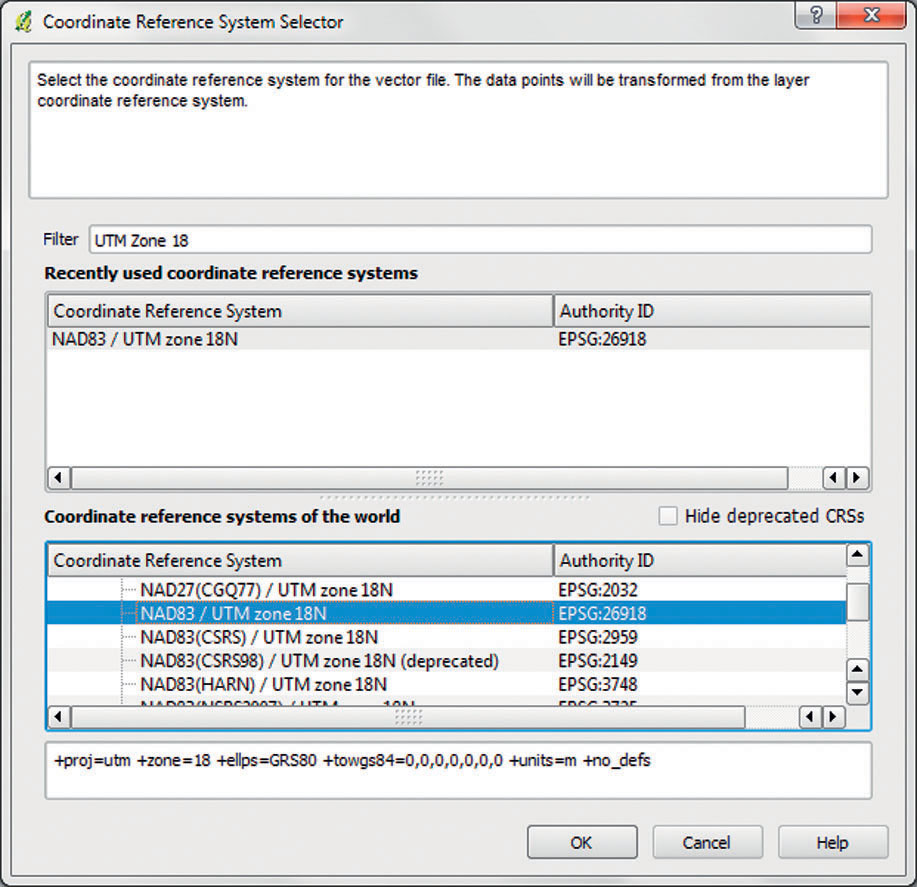
 - In the Coordinate Reference System Selector dialog box, type UTM Zone 18 into the Filter. In the Coordinate reference systems of the world, scroll to the option for NAD83/UTM Zone 18N (this has the designation EPSG:26918) and select it. Click OK to close the dialog and return to the Save vector layer as dialog box.
 (Source: QGIS)
 - Back in the Save vector layer as dialog box, the new projected coordinate system you’ll be saving the layer as (NAD83 / UTM Zone 18) should be selected. Click OK to close the dialog box and complete the process.
- Add the PointlibrariesUTM shapefile to the Map Legend. The points will now be visible, with each point representing the location of a library in Virginia Beach. Open this new layer’s attribute table and you’ll see that all of the data from the file with the addresses has been imported into attribute table format. Close the attribute table when you’re done.
- Lastly, you can remove the old WGS84 version of Pointlibraries from the Map Legend by right-clicking on it and selecting Remove.
279
8.6 Analysis of Geocoded Results in QGIS
In this section, you will start performing some basic spatial analysis to examine the relationship between the library locations and the road network (see Geospatial Lab Application 6.1 for details on how to build queries, create buffers, and select by location using QGIS).
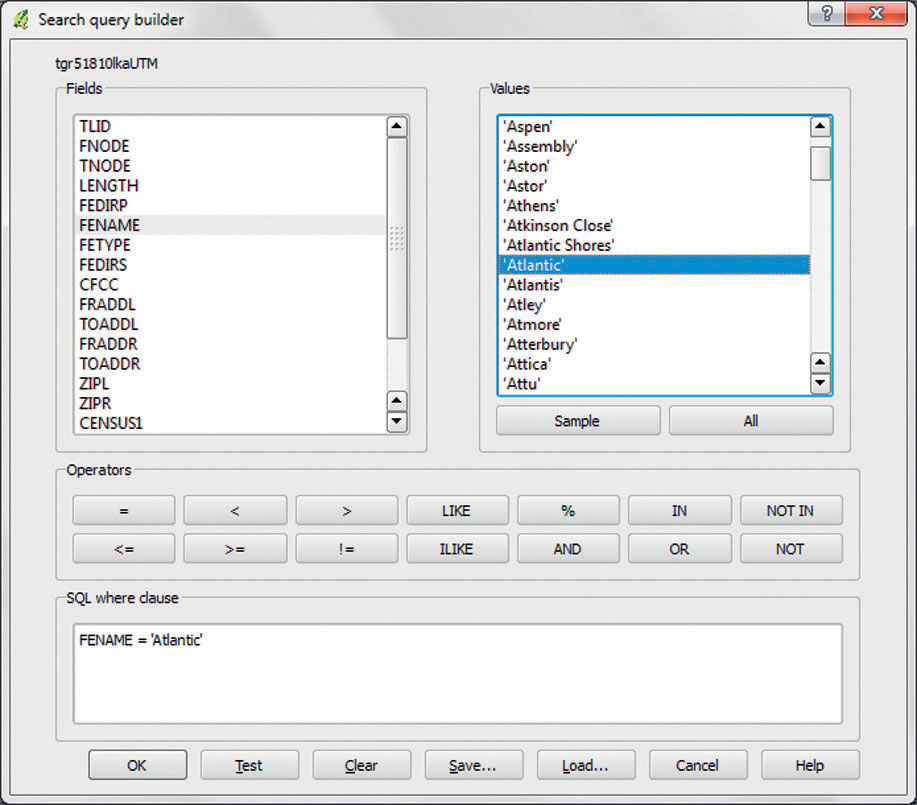
- First, use QGIS to build a query of the TIGER file and select all road segments that have their name (FENAME) equal to ‘Atlantic’ (Atlantic Avenue is a main north-south road that runs parallel to the boardwalk along the Virginia Beach oceanfront). Keep in mind that to build a query, you will first have to click on the file (tgr51810lkaUTM) in the Map Legend and open its attribute table.
 (Source: QGIS)
 - You’ll see the road segments that make up Atlantic Avenue appear in the yellow color of selected QGIS objects.
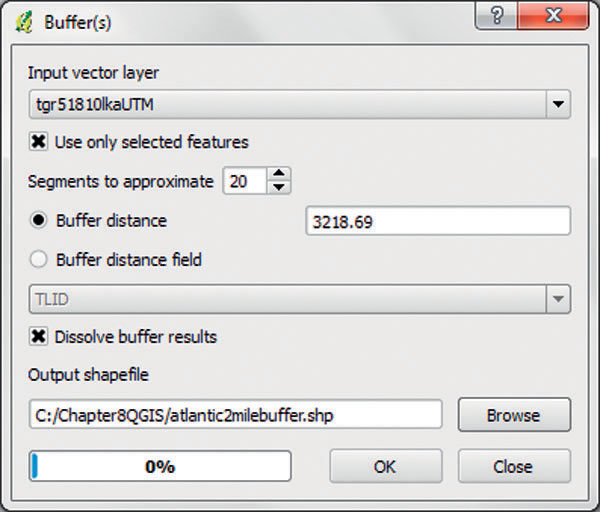
- Next, build a 3218.69 meter (i.e., 2-mile) buffer around the selected features of the road network. Use 20 segments to approximate and also dissolve the buffer results. Call the output shapefile atlantic2milebuffer and save it in your Chapter8QGIS folder.
280
 (Source: QGIS)
 - Next, use the Select by location tool to find how many library points intersect the buffer.
Question 8.10
xgpYXKTOiCbS2YeDU6eA5RIhUcQqMAOENvwDMGuzHoPCU65ErvmFQKYwMtR6DrutETrmCsBu6tZX3iPTVgIqYXjEEQ1dQ2ot4XL86jsg7mXihhhQszVUVA== - Clear the selected features from the roads and libraries and then select all road segments with their name equal to ‘Virginia Beach.’ This will select the segments that comprise Virginia Beach Boulevard, a major east-west corridor that runs through the center of Virginia Beach from the oceanfront on the east straight through into Norfolk on the west.
- Construct a 3218.69 meter (i.e., 2-mile) buffer around the selected features of the road network. Use 20 segments to approximate and also dissolve the buffer results. Call the output shapefile vbblvd2milebuffer and save it in your Chapter8QGIS folder. Use Select by location to find out how many libraries are within the buffer around Virginia Beach Blvd.
Question 8.11
jMjXCQYl4ftgAHe+0TpmZ4iqt3CZ6QHpx5+ggW8eJMn6wXs1pd8dOz2S1dRfhNGk21ksHeKRGmB1qqGRSciUMLbmlprLiazORgAdWj9qdV6MIt7+XWM4BaxfiTOHKjNlnuxqLw== - Clear the selected features and build a final query to select all road segments with their name equal to ‘Independence.’ This will select all the segments that comprise Independence Boulevard, a key north-south road in the middle of Virginia Beach.
- Construct a 3218.69 meter (i.e., 2-mile) buffer around the selected features of the road network. Use 20 segments to approximate and also dissolve the buffer results. Call the output shapefile indep2milebuffer and save it in your Chapter8QGIS folder. Use Select by location to find out how many libraries are within the buffer around Independence Blvd.
281
Question 8.12
3zSVXGYM0ysqKoPNsKbjG0qZ7Xcd+QlvYWVwwY4LXtNPtg0aJ54Y+ukYGzzZh6YDicd9IVxN6Boj5dT8fPxYo3+xEfZdn2OjbSA+RhGelH42yjRqB5lkFEDpm3Y9pnL1
Closing Time
This lab demonstrated several types of features associated with geospatial network data, including calculating a shortest path, geocoding, and using geocoded results in conjunction with a road network file in GIS. Chapter 9 will switch gears and introduce some new concepts, dealing with remote sensing of Earth (and the roads built on top of it).
- Exit Google Earth by selecting Exit from the File pull-down menu.
- Also, exit QGIS by selecting Exit from the File pull-down menu.
- There’s no need to save any data in this lab.
282