Chapter 1. Chapter 17: Life on Earth
1.1 Introduction

Welcome to the Interactive Study Guide for Chapter 17: Life on Earth! This Study Guide will help you master your understanding of the chapter's Driving Questions, using interactive Infographics and activities, as well as targeted assessment questions. Click "Next" to get started, or select a Driving Question from the drop-down menu to the right.
Evolution Q&A:
From moon rocks to DNA, clues to the history of life on Earth
DRIVING QUESTIONS
- What do we know about the history of life on Earth and how do we know it?
- What factors help to explain the distribution of species on Earth?
- What are the major groups of organisms and how are organisms placed in groups?
1.2 Driving Question 1:
Driving Question 1
What do we know about the history of life on Earth and how do we know it?
Why should you care?
Understanding the history of life on earth begins with establishing a timeline – a chronological sequence of events. Our original chronological sequences were relative: we could tell that fish, for example, were present on earth before mammals were. If we understand how radioactive decay works, we can develop absolute chronologies and date evolutionary events.
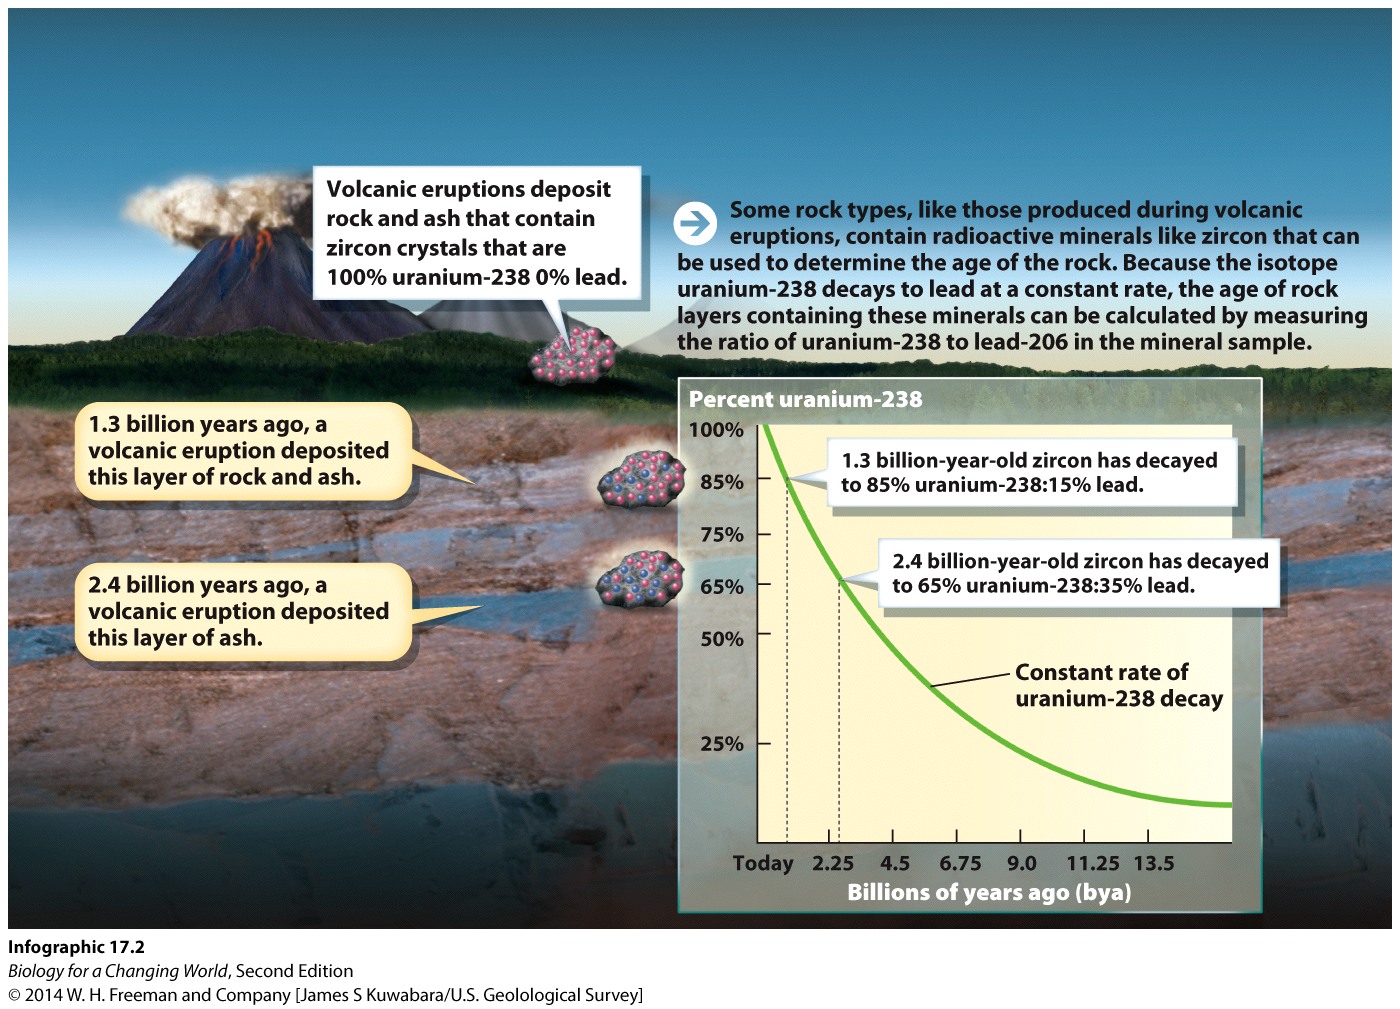
As you have already seen, we can use ratios of radioactive isotopes to their stable daughter elements to establish relative chronologies for evolutionary events. The greatest strength of radiometric dating, however, is that it allows us to establish absolute chronologies. If we know the rate at which a radioactive element decays, we can readily determine the age of a rock sample by determining the ratio of radioactive to stable isotopes it contains. Importantly, our “radiometric toolbox” includes a number of different radioactive elements with different rates of decay. This allows us to confirm the ages of specific geological layers using multiple independent techniques, and to date events spanning the entire 3.5 billion year history of life on earth.
Using a variety of relative and absolute dating methods, scientists are developing an increasingly accurate, detailed, and sophisticated timeline of our planet’s history. As historical patterns are revealed, they prompt questions about how and why those patterns developed. At this point, we are able to use historical patterns to develop and test hypotheses about the processes involved, then use our understanding of the processes to predict new patterns and to search for them. In this way, our understanding of the evolution of life on earth is becoming increasingly rich and fascinating.
What should you know?
To fully answer this Driving Question, you should be able to:
- Describe the process by which radioactive decay takes place.
- Illustrate the relationship between (1) the relative amounts of radioactive material and its stable atomic form in a series of rocks and (2) the relative ages of the rocks.
- Illustrate and explain how radioactive decay can be used to determine the age of a rock sample.
- Interpret information from the geological timeline of the earth and use it to answer questions about the history of life on earth.
Infographic Focus:
The infographics most pertinent to the Driving Question are 17.1, 17.2 and 17.3.
Question Test Your Vocabulary
Choose the correct term for each of the following definitions:
| Term | Definition |
|---|---|
| 5ysSR6MUTu8URvkr0YR6I6gZtah0kGTRdqDcTZU64Ssm8b47BgRgYyFAdRheFZS3rDuCKIX1QdQzKxyUitJxXltrRX22+uGRW1sTc2pyXXnRhB7G83lJOzbCScNsIIh/HURb2JRp659o3NnI/kiKIJW0FK/q8qZVwGriNg== | The time it takes for one-half of a sample of a radioactive isotope to decay. |
| gYaYxVbFEtNq8b0+kXHw3BPvrxuWS+uwdssMwgKQ2s2cTMhYUcBBHSz2mZKkCQP1pR6KTSnpiTquPslvEvRLp8TatNWY+RlDmPkmrK67/PMqoxEfprGMVZukGNjBW9mtxdmDrpIft9VlWqYczzpX2JnR/3M37DUE4GZFAw== | The elimination of al individuals in a species; extinction may occur over time or in a sudden mass die-off. |
| aPPqGSrEXWBcIbxu9aePEB76EO7D0zB6cB0eAN+AnEjYSjAc9ZXkxs1/I0qAplFo10HkyXRLFvDnWWFApxWc4yt9CaLA1jH10JP1DRQVIYDlQaW3qM/LHgglnnucc5KPJJFnijD8IpKBbsOroRRiBZMvOCQF8P97Nf+U/g== | An unstable form of an element that decays into another element by radiation, that is, by emitting energetic particles. |
| G+GQxy9jTPoRETFiDV5Sch+TwkA/s808mIDP2Hc90W5BND6zc1cl+07msIUdOaTjdznm3UKbTe0ThYke3IblBQMTLL/2sdVAL/octftC8NWk+JK5hrp08Hsm0bQfnJcjSwqg/uK9QbJRMzgy570S7gbtVmlgIeQqRGKt6w== | Periodic bursts of species change as a result of sudden environmental change. |
| akf8a5Ifkufe0EUQrKoVxlZ+3UyM1AFJwjSU+ueg5G1U9kquoGT+hKO1JQ2qZ0mbg3yFRVaN6QsQsq9fNE+KpfLBJttoGtVYNRkvIikq8MTzHa3HWSbdBQIJ0G3aJp0aOGI4biAw5nxcLmBPCIDDe/8tRBVNzj4SC+RsAg== | An extinction of between 50% and 90% of all species that occurs relatively rapidly. |
| 8P02ufloZr/v8G2+75h6v6n6MXFIUgRRWLu16KmOz9T5yoQ4pRmzMltkUyz2QD3guKQm0yhxHXbSRsrkAqZqqkVHUv7f2rwIU9QUud//fFpttjK0K3syvZM9SHR0ShQn991R82KJId2bRQ9I56e21njiN695ZE8IQ6dJtQ== | The use of radioactive isotopes as a measure for determining the age of a rock or fossil. |
| vISmYIqKA42CJ2FPu23lvdspL8WPb1fWQNznzwYKadlfbj05xnM1DyKhgkv3CxRcYLRm/xa8z3TlN4F094rtX69w0DU24ckm9RuoMCrDV7JzBtra6D0XNQ47KZq0byJAw/Jqa+ewmS+3aOS/glFKUXre87JndHpWqkAjag== | The spreading and diversification of organisms that occur when they colonize a new habitat. |
Describe the process by which radioactive decay takes place.
Question 1.1
During a radioactive decay event, an unstable isotope emits one or more jAAFw1q3xsw/rcjXhbzj4D/oMNQp1U/S.
Question 1.2
Radioactive elements continue to decay until they reach a XA0X25Ke3bakFGW5Hs0WTQ==.
Illustrate the relationship between (1) the relative amounts of radioactive material and its stable atomic form in a series of rocks and (2) the relative ages of the rocks.
Question 1.3
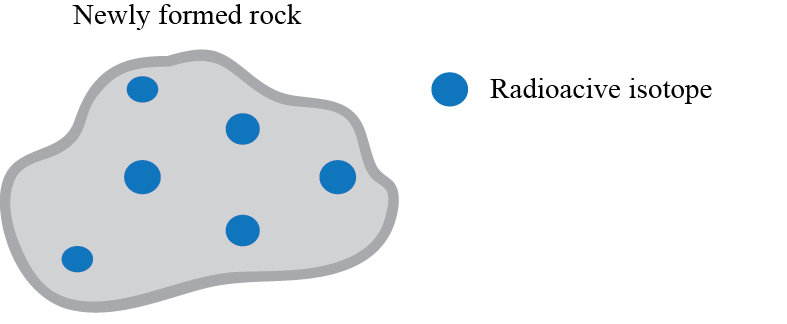
To illustrate the relationship between the composition of rocks and their relative ages, draw a series of diagrams as follows:
Draw a diagram of a newly formed igneous rock that contains several atoms of a radioactive isotope. Indicate the atoms of the radioactive isotope with colored dots or circles.
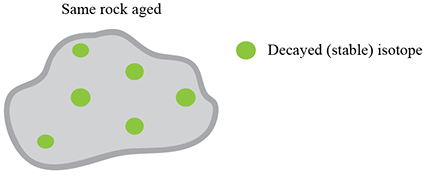
Draw a diagram of the same rock, as it would “appear” after all isotopes have decayed to form atoms of their stable elements. Use a different color for the stable elements than you did for their radioactive “parents”.
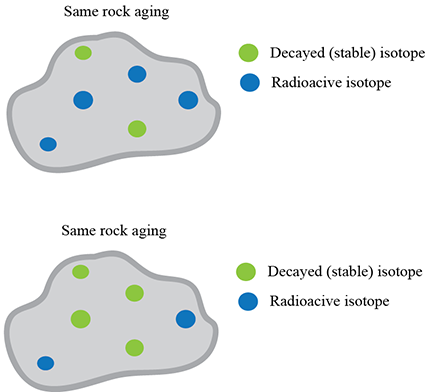
Now draw two new rocks, as they would appear at different times between the newly formed state and the state in which all isotopes have decayed.
Illustrate and explain how radioactive decay can be used to determine the age of a rock sample.
Question 1.4
Question 1.5
n8La+/MqM0ILIshL5JOq44x3Q6FwA+LAhQZMajblGuu4e6P7zZxZw5G2X0DM4mnZ3nDzhRwO7EQwP8zRUAUcWTdRFtMgSzEjZxlYLGL2w7dGQC5cqstKCtl29kaIwK0JyTAvpRZpjKRCFId0B6zw6xP9/XipG2ZApaU0xkPldh8Xql43B9fKVQSwIwkaYABmh7NBr6LOgzyENZo30V/vF+HGeqOrz1Kqo8Iz45WYnhk=Interpret information from the geological timeline of the earth and use it to answer questions about the history of life on earth.
Question 1.6
Place the organisms in the list in the correct order from earliest appearance to latest appearance:
| 1 | D3i1nAWwxVclOVttoVxe8nBHc7SJdmboITcfnZ4WYvJNjnYC/jIyn9AWpAu1ZM9sHknBjiRs5JcJpR7iz5cn1GS4u8/Tr9splIz1K/pc/P/gxnbSJnL7aaGpeyHH0D8Meex1X67urTNu6GplMz3zF40nqdIH8cFEH5imzqUKbIP4qZIkeK63rA== |
|---|---|
| 2 | XyMty4FoabIX/zfWLy+wxEyRJeaVeKJBGvoxacFrg9yHW6IUH+pH016XAVlw1efy/rx+90Emj9HJMAcu/g9D4tfXmgDxjcOy0ruaC4QQDrVQ4WL/ZOUHdhZJzdN6Wqp2ffoxmapoft/zGT3FdKksjZvsu2PKovI0mO9b9HVSx0t6wBqxwmOwAw== |
| 3 | /aIk2wG0vlJMXU1LwGlQ/B88sI9gNLjfi/SNjCYkQB+z+1yVNQnldEe3dskomamdPVdKbSOIPvfOW7fy4QwLmLBosbP2rEBuxhWoW3z2Thpq+Is/IDkski+VP3dj3hbVNGGDij0Xk6/SFzFEy+CSNWU5XLRcU0jzOKaN1Ll1WtILmz3W5cekSA== |
| 4 | Rp7mA4KH9FjsCIWpR/tIshmxIpfO75d4temIR1/toL4P63tD+b2czSREg5e7NSXtNqWcGN5aDwr5VQcHIEN0qsxQ9DmI6MaCO3ZEQ8NbewG4jmXa34GKBwxoA5yfbF9bChX2+IwaprjFtOWlZpSC9jwSbVCQWoJisukBC9io6qWUfopmoPrApg== |
| 5 | CEs2LXGPXAlCtTHANo3vNxN5vGYb8gZHpyVbRQmNqAdwk2fEmdEVTyO/N+q3zlnADSCiamNNqCi2igs2QWM2IQNL9TOjeNI43wyE7O+NDIHtmYGsoydwT79mppkmFtv85M+Q4QGfa3zMFs7UhjRQu9j/S4bsnQq8g+8YvIKbjDHOOHBQ31cYUw== |
| 6 | whZyWk6VQtpTFGHeR1bwMIHGlkweBnQpb6sGdJlfqNNak9C84N8PMgKPEquwG12TEJ7G17Ae7MYWMMxdrgTtvsYT2+IQtc05BTuvguC6AWpsL+YdlHt71o4hELFHn0vLh30IWJwkD34uCVX9+Kn3GjY1HyRBMWh1X9BWNwrPZaipyF3m9pA2DA== |
| 7 | XrKSokAutGkmp52sOxYLt4m45kVsfRmz4+NChDaWs3wjoQwOb5tQVoptyjRgLhnSDhTweA4Lcejw0nzuEZy71Q3xfYFNrPi0Zrx0wTMdg0qUkQGn5dK6dkaDnUZ0wBxL9c4FfUYfC9MzZzf2MT5029iNJmdwfpA1nFiCfowtiQOcUxtIglEWuQ== |
| 8 | viWrVO0vyxS6FiVA83aqTXCh/3PfnuMh07UPRXuk5E3ztML5VLkq6+lyA4iC+pvORWtgedJC+8r+WQcPALtfO77duF7LeT3Zs4UAMgUqT3wwQp2hBz6AreKjHx65EuPUmWfM2XukxBz9jNFvYqXLLqgR7r7ELV9llOhnGdrTIFcLBOYgP2flAQ== |
| 9 | rabVoSOvftsdKsvMTgyztLhRKCxUC5s/y73tn2Oww/UxNA5Agi5ZKr++SYTRhL7PI1KahnCC6bDa7HqPY7T3UnRGfvkIssFEsR1iqV2j0HDUyWyFoSX0cvMhWvjFPUWOQRKBAuhj4hX+NTuy0+4UtkShXmUj1GnwvGHplTQZnQsePrGUjxFNRg== |
| 10 | ZpWVVTACaH9RM9C4GmvESoffWXPBEj0UpvZe0ic4g7i3eDxl6pOLuuJUaf1+Epixbv4C7E1NAUZB8PvSDui8KzOUovZlhEbl0WmnICbHRfpmc+Tl6sMfcon6z3h3fkrq3hJ1f0pcjZbWhmRrnQ223ShuCkJTC5pYOLyQsFpCWM1Fm4X1nUXPrQ== |
Question 1.7
2a6lTx3CwJ1oS/L1pDwYdBxE1YWYj3AshS+kw203XaDXKvzBHOSU3LJDt6wyy/ETazmY7ATcDVqUHPPHXhxOCzVaKAao2C5AvK2bBmnolUXyq/RhQWglUw6XRS6vWUYPdopiFg==Review Questions
Question 1.8
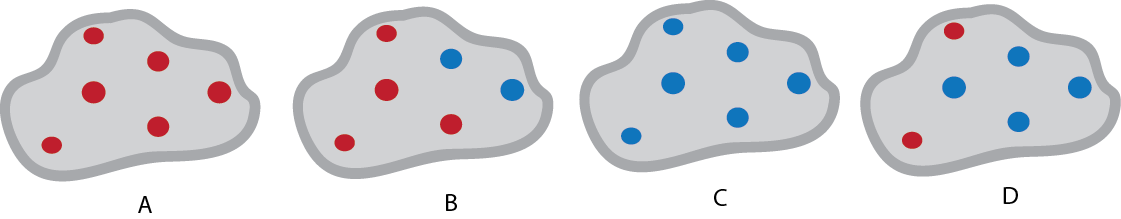
The diagram represents four igneous rocks with an unstable element in various stages of radioactive decay. Dark red dots represent the unstable element and blue dots represent the stable element to which it decays. Which choice of answers correctly ranks the rocks in order from oldest to youngest?
Question 1.9
MeMavlR0+r12mYtFLYUtKVieT8ShrQ8kQp1ui947jZBTtc6d5qI39AdJIpuneO0ath4N2n5TK8qnSdCnKt1CUUn/7XRADbvFyyJjSGx/cHs5/Pjlrarve5GJnOMyw+azKbhCHOd/YSZRrn3phMUi0+JwOojkuim5e88RGfoKHAG7ugiqrulEiwZvh+LDMCRoeX+uPnlYD+kQ62j2DeL4qZuDuAmv/Zf4zVOgWYcnsCibtI5Jgsftg0P/lq9GVDeK64Vb9AA717A=Question 1.10
cxJZFxCekcScMUvZii2zBrznjFxRe9oOAuD28izeb8rFaPcxy5QWfrxT9WwAh3KWgncAVWF6/umNBtQkEplrwgGBkJUj0U2x2aFZ9Hd1hg0NVhdLDTS4kXfXBxWvg7EBWlmMdCVQ/Pw+FaTiVjUsSjyarOX2irA8132Fg8dI5Qo8IT+xSnqNHlCZWC60UfRD+ReBWBTScuv1RZCAXuJWK1qvNWgpFn28z3svTvYqCcM7FknhzIRfPge3HP6I5a8y2vZJfg==1.3 Driving Question 2:
Driving Question 2
What factors help to explain the distribution of species on Earth?
Why should you care?
The distribution of modern organisms presents us with many puzzles. Why do we find marsupials (pouched mammals) in South America and Australia, when those two continents are so far apart? Why do similar climates – such as the Arctic and the Antarctic – not have the same plant and animal species? Darwin himself was deeply curious about such patterns and recognized that descent with modification was an important part of their cause.
What should you know?
To fully answer this Driving Question, you should be able to:
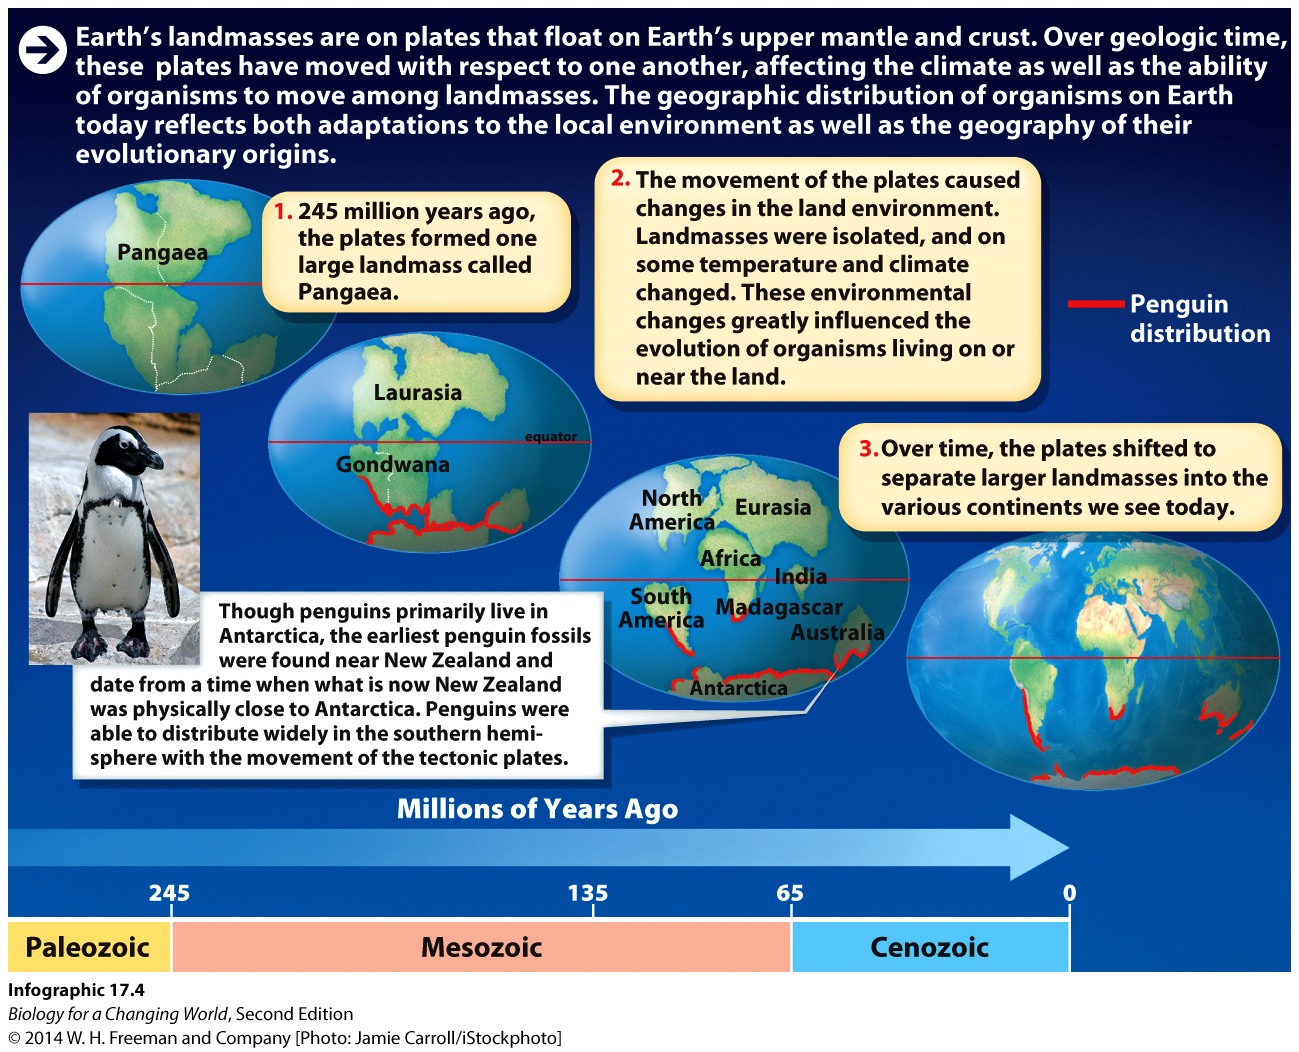
- Use the adaptations and distributions of penguins and polar bears to illustrate how evolutionary history helps explain the geographic distribution of species.
- Apply knowledge of plate tectonics to answer questions about biogeography.
Infographic Focus:
The infographic most pertinent to the Driving Question is 17.4.
Question Test Your Vocabulary
Choose the correct term for each of the following definitions:
| Term | Definition |
|---|---|
| 100oTMY96JyjBqo6gdl7aEMRu+drRsuGgHqSiBvttfoBezU4/C+oCLlJTeNWh6iw+wyZa3VtTiA= | The movement of Earth’s upper mantle and crust, which influences the geographical distribution of landmasses and organisms. |
| cV5D8QzVCqP7EIyNKRTh4TUIUyyWUFovQKHHji+paEgou8yvpxhgKGIGR52d8yUgIVqPT41nKuc= | The study of how organisms are distributed in geographical space. |
| ARjRhyCyvYGqk+R9O9/A7ijR7vdyriXAqWDioPXqakLNYDPiYzghsBLqeJ3xsSbeq6M4+6x/joM= | The process by which organisms that are not closely related evolve similar adaptations as a result of independent episodes of natural selection. |
Use the adaptations and distributions of penguins and polar bears to illustrate how evolutionary history helps explain the geographic distribution of species.
Question 1.11
Y+VjiovaBlh/lLyZ5hSuDW+nJYb3uvsXWyzqZVw4YrbYYyWVmdLSso8ywN/dGh4KlSLVjXOWtJdOX+QZzmRU//4gyA79XI6pCHB98KekKXCIpdUZgRnCtbTcPsyKKJ3ctN41uPporIYsJkahiN+r8k4Uibo39YkezHoAXg==Question 1.12
n1cz1rgGd//7lmfCwq82kUxikPSa6FnTphs+gm0ODATWE/VfElTvgui/D90kiD67YeSnBMZd1Wk4F4UY3bHuQQ==Apply knowledge of plate tectonics to answer questions about biogeography.
Question 1.13
Question 1.14
kIYIfAFeo4m7U1YGVq36ORDfdQzMfGCO15tlnKyxwJ1im0MFJ3Z9Yy4ILd7FOdhr4KrGnxIAmkAIyE8En6Xy1bUYG9kWjruJje7zWXQLrSu3r0/dwiNvM2Elnm1dtsmWvawzSShDqqq96f0v5LIe2E/uQhkY7CERpPRFj15NlAPPUVWGJwLWevV4D1P1dx3tFM8QhyCeA7YJHQCJ2jCA8UJt/xiEJsv3E/jISxbLiWqqvE6iyoaz5o7p6+ufvpoErkGXCeGTOWs=Review Questions
Question 1.15
xnN37Z62etE5jaPt0u5fS/FZLUZU9b6tI9lPdv/wT6CLcl80cVSR6tfmr4JlxFRpDSlHDhxtABeCkjwYfwaVvXDOw1uQdLDYVJVYjoTub3t4CIel+1QR46tUst7cyRzLXbir8F3VCM1PPwEVEOZtwGrThb3dxBK1H/Zl217c2CDrG6hfyDQEkw==Question 1.16
9csjscWO+qUq4c4nfw0kxqYkV/PfnEmVSvNEvjnIwGIC9o8KBS9H7LCT8Faldc0USJeyGwD5FwkWxX+uajBnKdBgpOi3qzx7wd+t5/LD8fpiRBbW10+BdOeTT0ZKZc1bxcCJ2qayHeYRzVs79XJ6mEgvhIF0nvU3BwtlTcPBBGOUlbMq3Wohd4vN7RQTCb0ZjAQvBYNC6GjOi3tR1.4 Driving Question 3:
Driving Question 3
What are the major groups of organisms and how are organisms placed in groups?
Why should you care?
We know that humans are causing many species to go extinct. But we don’t yet know how many species live on earth, or where they are found. We are more confident that we have identified at least the majority of the larger terrestrial species, such as birds and mammals, but much less confident that we have a good understanding of invertebrate, fungal, and prokaryotic diversity.
Classification systems allow us to store and retrieve information about the objects we classify. We all classify the objects in our everyday lives, and we are able to communicate information about those objects because we share common ways of classifying. So, for example, if a friend tells you she bought a pickup truck, you know something about the shape and configuration of her vehicle. You know that her vehicle belongs to a larger category of objects called “motor vehicles,” but you won’t know much about the details of her truck until she tells you a smaller group to which it belongs – its make, model, and year, for example. Biologists classify organisms based on their evolutionary relationships, which are generally reflected in their morphological characteristics. To a biologist who knows how a group of organisms is classified, the name of a genus or family immediately brings to mind a picture of what those organisms look like and where they fit in the evolutionary tree of that group.
A picture is worth a thousand words. Evolutionary relationships among organisms range from the simple to the highly complex. By displaying complex relationships in visual form, evolutionary trees allow us not only to understand those relationships, but also to develop and test new hypotheses about them. The clearer the picture we can develop about the evolutionary relationships among organisms, the better we can understand the evolutionary processes behind the diversity of organisms we see today. We can use our understanding of evolutionary relationships to improve our own lives and to conserve the biodiversity on which we depend.
Similarities and differences in DNA sequences can be used just like similarities and differences in morphology to help us tease apart evolutionary relationships. DNA is especially useful when we are trying to understand relationships among organisms whose morphology is either too simple or too difficult to observe to be useful. Although scientists have known for a long time that eukaryotic organisms must have descended from prokaryotic ancestors, it wasn’t until we had evidence from DNA that we were able to establish our origins with certainty.
What should you know?
To fully answer this Driving Question, you should be able to:
- Apply information about the number and kinds of known organisms to understand broad patterns of biodiversity.
- Use information about the classification of species to infer evolutionary relationships and patterns of similarity and difference.
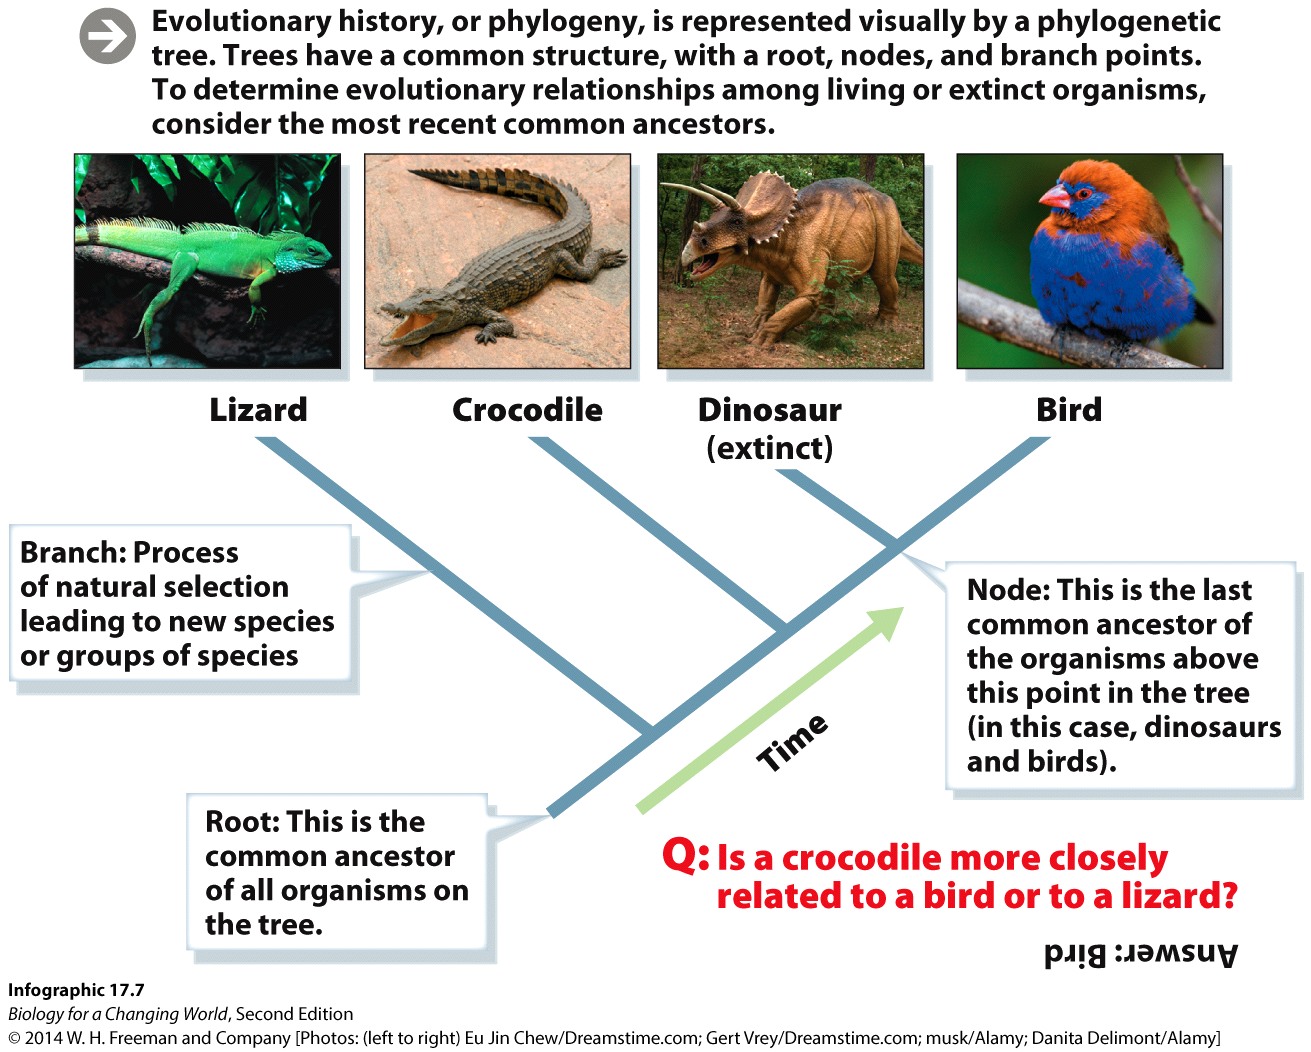
- Interpret evolutionary trees to infer patterns of evolutionary relationships among organisms.
- Explain why DNA evidence, rather than other kinds of evidence, was needed to resolve the evolutionary relationships among what we now recognize as the three Domains of life.
- Interpret the evolutionary tree of the three Domains to infer information about evolutionary history of these groups.
Infographic Focus:
The infographics most pertinent to the Driving Question are 17.5, 17.6, 17.7 and 17.8.
Question Test Your Vocabulary
Choose the correct term for each of the following definitions:
| Term | Definition |
|---|---|
| M6VFao3VLNADz8HhSuV01yQKY6Cp0pIFrA2K7c2TondjX2lIjNThuNVsKvymFlrbxhLju2Lh/p2GGAe+lg/WaPflhLeWlerA | A branching diagram of relationships showing common ancestry. |
| 8XG39QSx0H2yPk2g+FVpYaQnTdP9aabQK2fUAJLICm0nJhX2KZLJIw424o7kMOg4sOaiIVKY4UbBCokW8QR1kizq7DJsTmbZ | Animals with a rigid backbone. |
| gBYsuVD/oHbnbKCnhWIfuYJUifJHHTFkwpH2leV8HfWVVXK7wWkxRt4WvzaTfMnS7PrO/is3VHszEmQ3Rfn9UYlNtiA2ruU8 | The process of identifying, naming and classifying organisms on the basis of shared traits. |
| at0rnWo8O7hlt0qcwLvYSe6+davvlR/yC2PDZwW+j6uxU8EZz9HdBLTR9Srg+ekShxQRhTfoGuxrfmcR7QPoF19eUu5wL7FQ | The highest category in the modern system of classification, there are three domains --- Bacteria, Archaea and Eukarya. |
| vQb+Gcn85NL5YTLB/KV9A33gbVCRIlyZp2zYY+W3N96SPNv2gegyJxZy79eP5I5H3gMSass6IWka8Qmc1lXadQ50/cG/Bi19 | The evolutionary history of a group of organisms. |
| /4v4xJ2E0lHYB5Xa/lQwTOq94WCgMXq+IXoEyKki4rKgWrQzRdo9xWUge1cSabZMSu/lCeLP62EYx6OrQ/hSrs2KA74GUkt2 | Members of the class Mammalia, all members of this class have mammary glands and a body covered with hair. |
Apply information about the number and kinds of known organisms to understand broad patterns of biodiversity.
Question 1.17
ocz2x0rxVc5FAGeJsyae69NGoaaQpwUwLp+QPrTLxL1ZAe9cc2P8ZxXvLZcJi6/4AQvE/N46xaexYnhz+ICD+fAme/fSYB1RGssJhoaivvoAwPzfoCkGx5Z1Q/YD4IqfxzayAujB/MSz9Ztsrkqnt02t9mAu5pUpp3dBMLeW/qKgRaZkutI99utbzaxP9HQtlY82lFnW+BFRMbNDMzcFFs00dqee9Y6wThDeen9DG0yezsJS0GCmM59nWuRyKJU1KfJ6uu38JAcS18g11pHKTQ==Question 1.18
C7XDBn5HgR/FkyPWgnyibWLR8dzcf4/vO3MO6rxYv68W5aL9WRykYNjoJ+5Z8GnwdtVGtdxEfRUm2PYYzDCQ52+DGl+OClHhQuestion 1.19
z4Z5knImO+eEOCQVBg9dQlRoN9voni2wlXUY0w3uJdF66re8ygNzBnCnt8/Xivq4q3t4DMUHLTUgHTIH9unuBrAnsEkdgBg9UVQ/gd/N/n6y+PX3p4agmP798HPiJUZY9xJfBIrJSejWUERrj/oMf8cSS2BKHx8P9daFcL/6E6nG9UgTtasiBd5tZvNvM8/bpt2fZCHNHn5TqUF8cr5UGk8fFLN3pBJOnXPkfqCDvu35pUH0ZJ9DhVnfGQo5YryJbek/AC9qEejQuZbpxtitZNtv7ql3iZ6IUse information about the classification of species to infer evolutionary relationships and patterns of similarity and difference.
Question 1.20
Use the information from the following classifications to answer the questions.
| Vampire Bat | King Cobra | Black Widow Spider | Trypanosome (Sleeping Sickness parasite) | |
| Domain | Eukarya | Eukarya | Eukarya | Eukarya |
| Kingdom | Animalia | Animalia | Animalia | Protista |
| Phylum | Chordata | Chordata | Arthropoda | Euglenozoa |
| Class | Mammalia | Reptilia | Arachnida | Trypanosomatida |
| Order | Chiroptera | Squamata | Araneae | Kinetoplastida |
| Family | Phyllostomidae | Elapidae | Theridiidae | Trypanosomatidae |
| Genus | Desmodus | Ophiophagus | Latrodectus | Trypanosoma |
| Species | D. rotundus | O. hannah | L. mactans | T. gambiense |
Question 1.21
qooNHnoM/STwEgy1viE4lXVVUNPpJrzM8ZPn3YuAo44Vjo1wZcRpGQndcthZv3hPh0mwpevl0JQjfjuIkjrcx5u7ICjkLIG4l+MrofWM2CLmzKTKeKCTEly5/nWkx++psOCpjrwkba4=Question 1.22
780RtlTJXeNt2wxbZOkY+uIZR797bLTlMz9D/Nr1VP2i+CMprGO3aXIKx2EUo/JpBnU9QE2ClMVRI3P64at1y/aIkuh4n+eSMuLAY+865dvQxKnl+6/SKg==Interpret evolutionary trees to infer patterns of evolutionary relationships among organisms.
Question 1.23
Question 1.24
HJeNI8CqULIuZzK/CLY7TP4qIKnms0CbBJgzvIboWHpHLFBHI9YQ5IUHD18/IEFtcWdE0ky5nR/fqX/H/HK6/mfPaeX7eS2uGF8jq+uCt4J8+IjHvy8zgRrbW2z311+Z1O2NcXOu/mufr+a0vy9LbEjN52RwdRRGQIl9dhNV8njDOcFI5RWllg+bEnCOYH7WxPuOEP2GIC+j1gDJyP5+58rIsUHeggc/5ZTK6S3ydsOIWjK9jYGQ2dvPbOw=Explain why DNA evidence, rather than other kinds of evidence, was needed to resolve the evolutionary relationships among what we now recognize as the three Domains of life.
Question 1.25
n/nR6zp5FhUEYz7umpJOpdNouNpDWBSQbp86eWdCF0TqT+Nd67WBRRMu5LUOGO/dmfCSVASknVKshgSviSincg==Question 1.26
Th8avcfS8SlkSnnNvRDc77iIvnfJr4g6d4zNJM5oUJHDcthyH/vUxQcJKnE9uhVdzo9GLtj3WHKicgybSvrhllVbVqn6ZXS6eEQ8XLUsaJfIeiL5vSQx9nrZgxcEIZ46tQ8foJ7FUrCGMZmW31kQwseAnrolglYTKxJ3FWFTIjD+cB5pm9EldgX8EDAYHvI0ShN3Mw==Interpret the evolutionary tree of the three Domains to infer information about evolutionary history of these groups.
Question 1.27
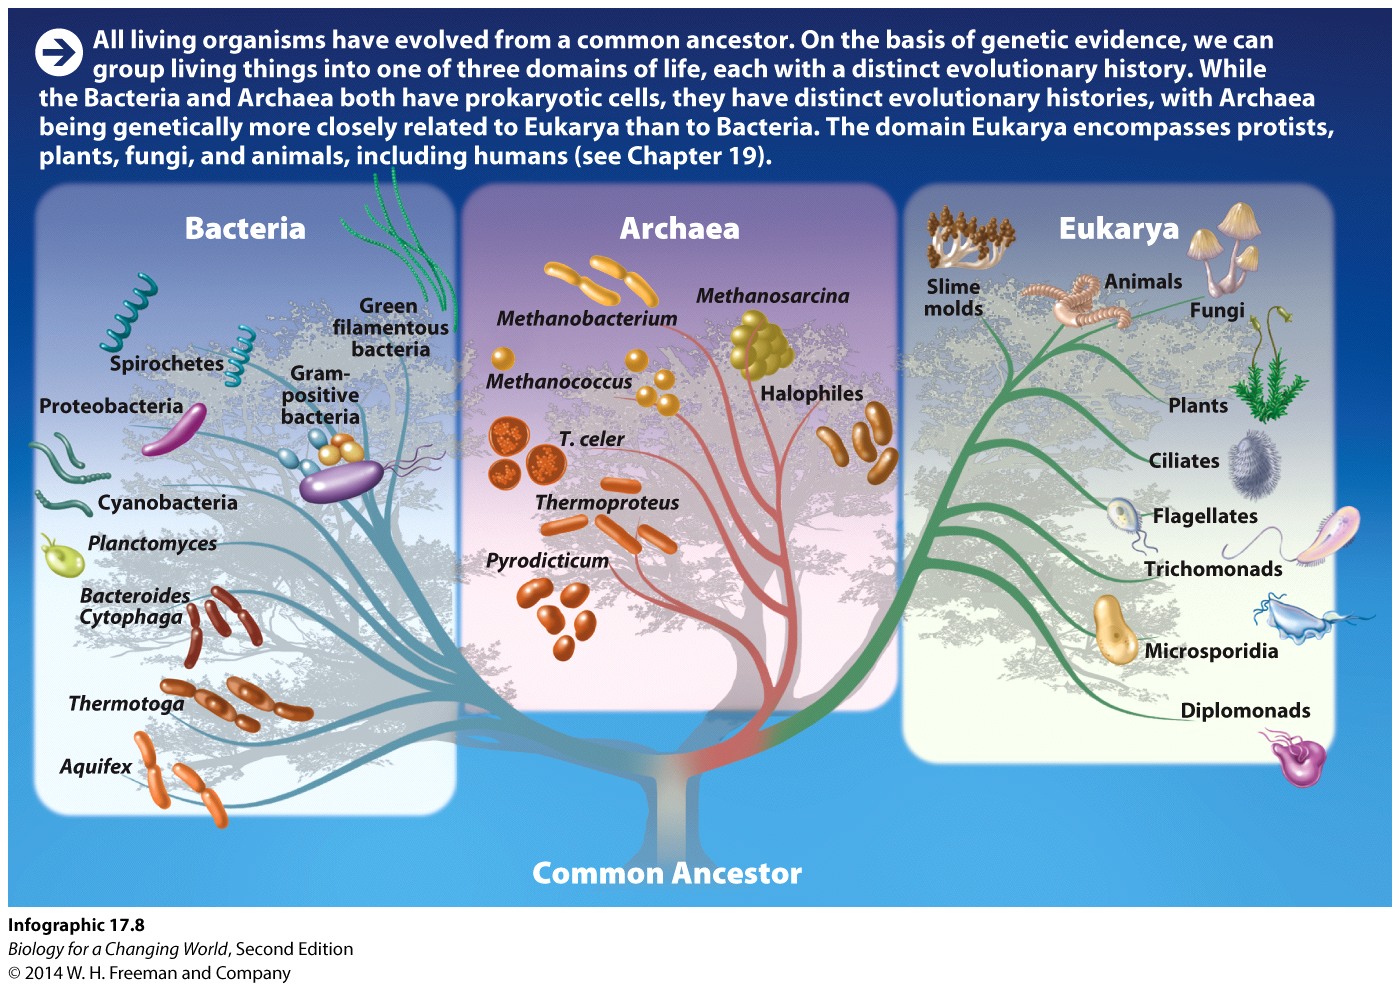
Question 1.28
y40guhq9WONcmRtKq/F6Lncg9mtMtyixO71w5UiRz6H6Ta20OytlN7Ugyn0pgIiRXfoKX+8ZvTmDmX0749fFaXoIRjo=Thought question: Both evolutionary tree diagrams and classifications reflect patterns of evolutionary relationship. Without the evolutionary tree, could you tell which two of the three Domains are most closely related based only on their classification as Domains? If not, how could you add to that classification to reflect their evolutionary relationships?
Review Questions
Question 1.29
/gldv+5hcWw1EWUlpsxvYY+RRWGwUUbZUYxgVAPOtCLn2VCcjeVJ0iG3wn7pTgjBTOq2+YFyjf2qbc3NtmHoCzhpNu2JmiSx8j+0GEMcIpFJ/wXfhBCIAH1pLSbHWT5h++0Tf59oxsu6G43ZI3KL4xEdy5BESJgoRd576BUYQuv6JBISpU+1SsOqkgRcpKzYBkYl+cOLVGQ6pzDv3J8Vbha2vTlISipTo0h9IMNYy+a/RXRCHT7wCFG8RLmI5jC5UO3RPP7y8eypCOFAJrhIrEiIi/C0zv4daYgu5eYr+hCEIZHmdxFAv4PR2MrH8U/qS6wpGQ==Question 1.30
kQfV7BCxsqSG+ngYWk44gBqvPodoyRMr+oVrhXUkUXfATMQqM36FWtDIFukft6cKaWlwdFJdNdH3Zkr1nqp9q/UKPGLSP8AyOQ666AwSJOWtUPmLkRM8g2ewg6tGZj130wYxxENlQNpFenZty/goLDxP2UZQvLKzFltwOuC0M7qzVfgcJQYO6Dkip3/Ieg6ZCIj8srnNXNaLxTi12vJt57bgkaEGZj4BHmy7UXk+ETmCnrOo2yGeLnH86MBHrFCsEycafvcizmPI35OVpeSVjQ3YXsP0cYSGAjXMH8whjDEtq1J/OjgQRIC76wgNh1f9hrzvaA2vRAykgDnNBk8EgGFKPTuZbCxpECA3/XUXWPnlWgsd44JXWOeLOB1sZbp1Question 1.31
gzwlycH/ZujBNOXYOCD/6o/NyfL/ZWeRf4+ki/8uJ0oAlB0+v0Xi6tUii/t9lq9r4QsKPI5At0ojZo6k100+lPtcvTpV4ZgfZUlIAh94kDK8QjygKsaVroKaTl/BDPWDnSgeIYhzS9ejE/WcMS+qQIHvxuBcQBLV1ou7H1ahXM2OWcqRAC1IJtycV/B+h7B7crOaFw==Question 1.32
| Maidenhair Fern | Giant Redwood | Live Oak | Dixie Iris | |
| Domain | Eukarya | Eukarya | Eukarya | Eukarya |
| Kingdom | Plantae | Plantae | Plantae | Plantae |
| Superdivision* | Monilophyta | Spermatophyta | Spermatophyta | Spermatophyta |
| Division** | Pteridophyta | Coniferophyta | Magnoliophyta | Magnoliophyta |
| Class | Filicopsida | Pinopsida | Magnoliopsida | Liliopsida |
| Order | Polypodiales | Pinales | Fagales | Liliales |
| Family | Pteridaceae | Cupressaceae | Fagacea | Iridaceae |
| Genus | Adiantum | Sequoiadendron | Quercus | Iris |
| Species | A. capillus | S. giganteum | Q. agrifolia | I. hexagona |
*Superdivision is a category between the levels of Kingdom and Division
**Division is the botanical equivalent of Phylum
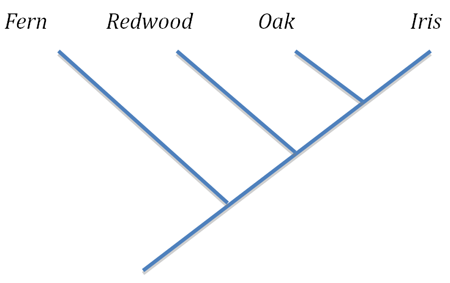
Based on the similarities and differences between the classifications of the plants, I think the fern and redwood are the two oldest. The oak and iris have the same amount of differences, so I had to remember that an Iris is a flowering plant, which evolved after seed-bearing plants.