Chapter 1. Chapter 23: Ecosystem Ecology
1.1 Introduction
Welcome to the Interactive Study Guide for Chapter 23: Ecosystem Ecology! This Study Guide will help you master your understanding of the chapter's Driving Questions, using interactive Infographics and activities, as well as targeted assessment questions. Click "Next" to get started, or select a Driving Question from the drop-down menu to the right.
The Heat Is On:
From migrating maples to shrinking sea ice, signs of a warming planet
DRIVING QUESTIONS
- What are ecosystems, and how are ecosystems being affected by climate change?
- What is the greenhouse effect, and what does it have to do with global warming?
- How do carbon and other chemicals cycle through ecosystems?
- How are scientists able to compare present-day levels of atmospheric carbon dioxide with past levels, and why would they want to?
1.2 Driving Question 1:
Driving Question 1
What are ecosystems, and how are ecosystems being affected by climate change?
Why should you care?
If you live in the United States, unless you live in New England, chances are good that you don't care about where your maple syrup comes from or that yields of maple syrup produced in the U.S. are declining. You should care because maple syrup production relies on cold winters, and the decline in US production is evidence that the climate is warming there. Changes to climate affect ecosystems, and we are connected to them, even in as mundane a way as what we put on our pancakes.
Does it really matter if a spring wildflower blooms a week earlier in the year than it used to? It might if that plant’s pollinators are still on the old schedule. Furthermore, early blooming is another indication of warming climates.
Mathematical models are among the best and most common tools that scientists have to predict what will happen. Unfortunately, the general public often doesn't know how to interpret them. People frequently respond to models in one of two ways: absolute skepticism since they are "only predictions", or blind acceptance since they are "scientifically based." You should know how models work and how experts use them so that you can make more-informed choices.
Humans are often apt to divide the planet into "nature" and "the real world," but they do that at their own folly. Humans are natural organisms too, and—although they may make more complex changes to their environment than most organisms—they are not immune to impacts to ecosystems.
What should you know?
To fully answer this Driving Question, you should be able to:
- Interpret data to describe changes in plant flowering times.
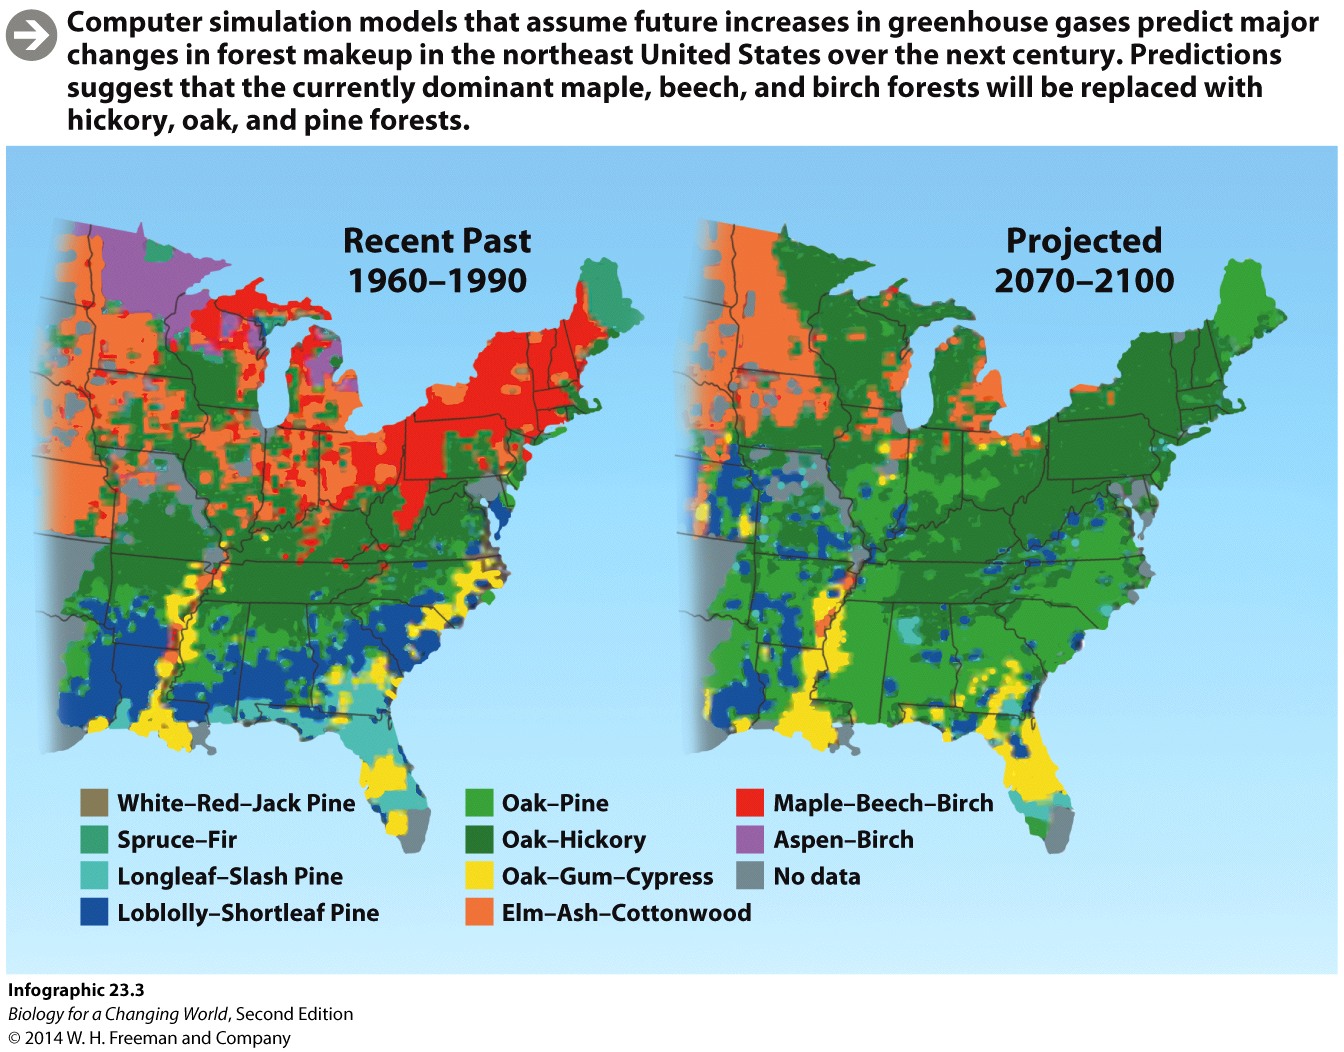
- Explain how changes in climate can affect the distributions of species.
- Explain how the effects of climate change on the range of one species can affect the range and success of many more species.
Infographic Focus:
The infographics most pertinent to the Driving Question are 23.1, 23.2, 23.3, 23.6, and Up Close: Biomes.
Question Test Your Vocabulary
Choose the correct term for each of the following definitions:
| Term | Definition |
|---|---|
| F2gN+1DdMcIq/VcUDWWER4bNTTI4sbvzI0nC/BZoSTE= | The physical environment where an organism lives and to which it is adapted. |
| leYkSePNcpShOy4LNb9yw3c+gIrEZoaSsyN6feQhw0A= | The living and nonliving components of an environment, including the communities of organisms present and the physical and chemical environment with which they interact. |
| jMzlgi+57Q6QTyGjRZWhTHvhwhq1CZPdBkdPaeDEUhk= | A large geographic area defined by its characteristic plant life, which in turn is determine by temperature and levels of moisture. |
Interpret data to describe changes in plant flowering times.
Question 1.1
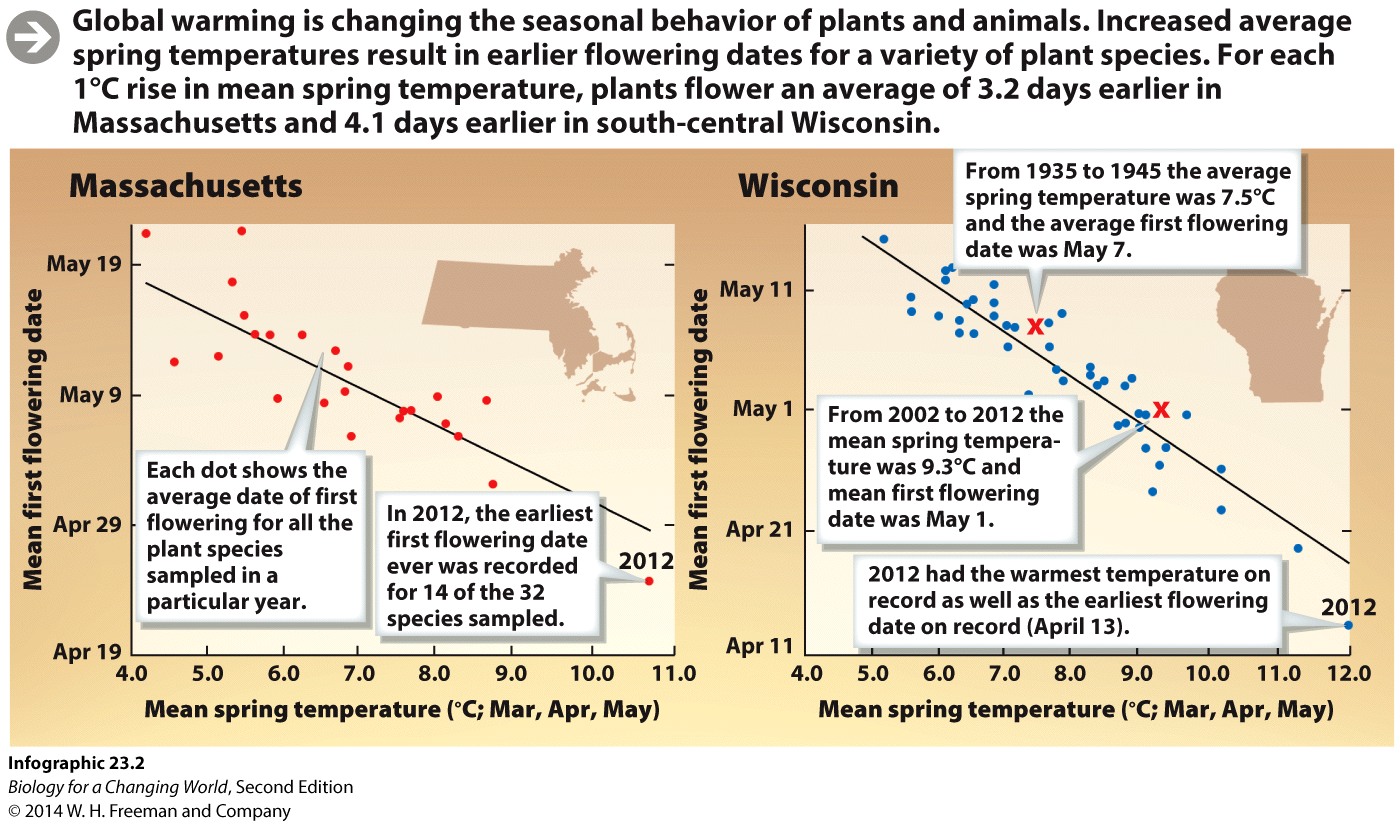
Examine the graphs in Infographic 23.2 to answer the following questions:
aVsbV7X/Chdh9ZzU4/H0yolABdHLd7Qm1NNTr5NfxKH7XaXeFSwd27Gojv2tfz1IXwkPCv+q0FKvbn33BtP+pg==Question 1.2
M5ILDjeA/+OXrEI6EbQHUTJGoxlOFAK21j6rVReyKOz7FWi3tUXiVkw0hp4fCCrCjdlEasJlBnQyJC0kfN9TMy60/v3NFWStJz07YUHPAaQdmNaJ8kcA/vircAsEbOwW7cQXKx8u3LaQ08J+Question 1.3
vyoLBnCaSJ+2SEs0k3XzI1L8qA0ZmvRjXdA55M76LJWrNkShkdYjmIu8T0kGd59RJN+hI8Jm1HHgZjdSygMQXC3BSVuvGZudRTNQxR4/66uzR6OVasKlaSJnKx5V5a5rHnQc0w==Explain how changes in climate can affect the distributions of species.
Question 1.4
Question 1.5
E6kc8IOO3nCBsAoeblOlP1Zi/JlsHMTTnVUWYwGvq8ephGXa7X6U7HcV/mCSSClJVYtBhefUp+3Xwb09Explain how the effects of climate change on the range of one species can affect the range and success of many more species.
Question 1.6
What are the underlying connections between climate change, flycatchers (birds), caterpillars, sugar maples, and forest fires? Using the blanks that correspond to the text balloons below, describe the underlying connections between climate change and increased forest fires in the northeast.
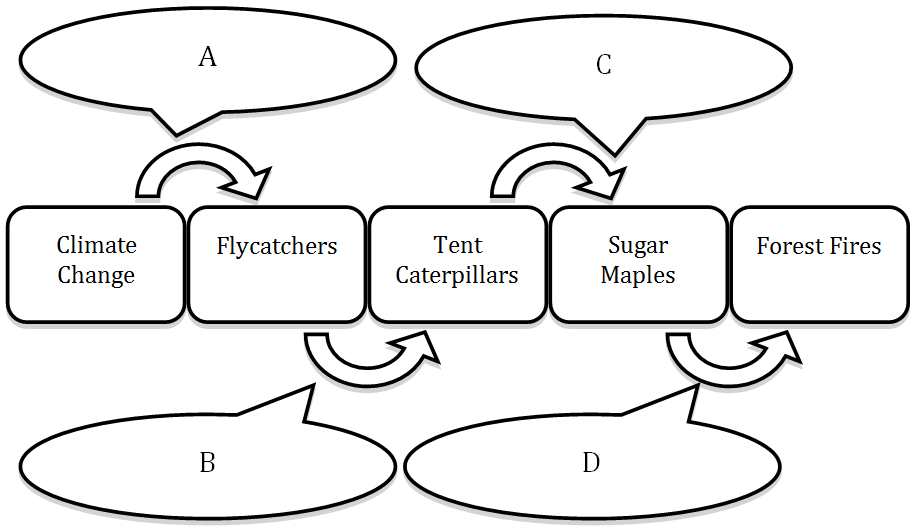
B = As a result of their migration, flycatchers are no longer feeding on tent caterpillars.
C = Since they are no longer being preyed upon, the tent caterpillars can feed unchecked on sugar maple trees.
D = The uninhibited feeding by the caterpillars will kill many more sugar maple trees, which in turn is more fuel for forest fires.
Review Questions
Question 1.7
Question 1.8
Question 1.9
1.3 Driving Question 2:
Driving Question 2
What is the greenhouse effect, and what does it have to do with global warming?
Why should you care?
Global warming (perhaps better described as global climate change) is one of the most contentious political issues of our time, and at the center of it all is the greenhouse effect. The greenhouse effect itself is not up for debate; without the normal greenhouse effect, our planet would be too cold for life. What is contentious is whether humans are adding extra greenhouse gases to the atmosphere and intensifying the effect. One way or another, you will be hearing about the global climate for the rest of your life.
Carbon dioxide is not the most potent greenhouse gas, but it is the most plentiful. The coincidence of rising carbon dioxide levels and rising global temperatures led some experts to investigate and document where the extra carbon dioxide was coming from.
Why care about rising temperatures in the Arctic, Antarctic, and Eurasia? Isn't it a good thing if the poles warm up a bit? Well, rising temperatures at the poles could lead to increased melting of polar ice and a rise in global sea level. Over half the people on Earth live in Eurasia; rising temperatures there could lead to crop loss, food shortages, and heat-related health issues.
What should you know?
To fully answer this Driving Question, you should be able to:
- Explain how the greenhouse effect warms the planet.
- Name some of the common greenhouse gases.
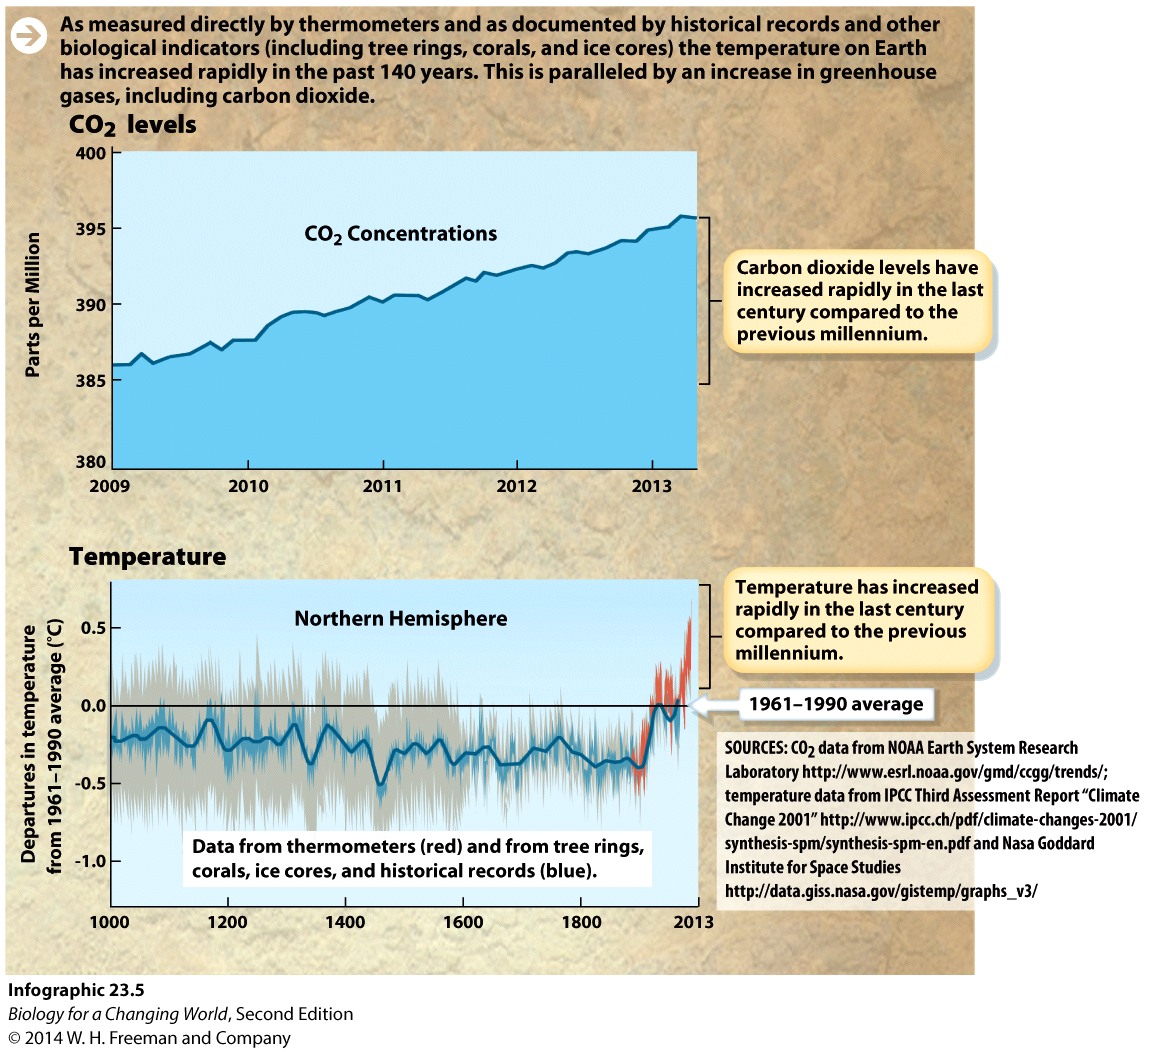
- Describe the relationship between global temperature and carbon dioxide levels in the atmosphere for the last millennium.
- List some of the methods used to estimate temperature and carbon dioxide levels in the past.
- Describe the changes in average temperature at the polar ice caps.
- Describe the relationship between climate change and the size of the polar ice caps.
Infographic Focus:
The infographics most pertinent to the Driving Question are 23.4, 23.5, 23.7, 23.8, and 23.11.
Question Test Your Vocabulary
Choose the correct term for each of the following definitions:
| Term | Definition |
|---|---|
| b1iM/WkRrZ1h0tDJj0cvg81Fnni7u+GYNPuqWinxedBKYwzDkS3T1AMcrfPgBFRttLJDYPMbLzZiRFw8rxhRSHu8KEiXeQrKncihVgvOp1U= | A carbon-rich energy source, such as coal, petroleum, or natural gas, formed from the compressed, fossilized remains of once-living organisms. |
| z1MpMFc3eB4HhsVkx6QtglOWGiXKZH9V7q2APy/S1lxFdWgQTqSBGxso/klnXpJ1fEWNqfuE2ZtiwQkRg4whfDAgWZxPcTNyifJ52Q4HOEQ= | The normal process by which heat is radiated from Earth’s surface and trapped by gases in the atmosphere, helping to maintain Earth at a temperature that can support life. |
| pO3omqZ7aAX4Rt+0nThj+YQzjpA/hcECmRYEBmsN6PdNp9MhNZNM1xA60W4dGgXKhAbhM9n1Zrdicdd9BlQWiBSs2lQ+SayP8zebuvZsQVc= | The movement of carbon atoms as they cycle between organic molecules and inorganic CO2. |
| kpFXY2u/lMSaZBolwmGm0dfjTmnzi0Sp3dhT4KWLzDMJ3HmIS5hJadXPryLmJQSV5weyMrrnwBrEdBmqoxQByppulZUg3TPZRcOaHThYQ+Q= | A measure of the total greenhouse gases produced by human activities. |
| abOq+ANOqDcc5HSYb6oP5Cf4vlHWjVd4cycbsHiNFhC9YPODyfVnvavxbHVp5w0SPTsf1VPOzjooxNs5Y+9auEhVzhhsHtO4KWgmShFuhw0= | Any of the gases in Earth’s atmosphere that absorb heat radiated from Earth’s surface and contribute to the greenhouse effect; for example, carbon dioxide and methane. |
Explain how the greenhouse effect warms the planet.
Question 1.10
8yPZ693dXrj1Dz4VbXbwT8dMN1gbRsd6/XKiruOpeT5XpySHkoUSD52QGzKFrpJW1wqcgzdmKsCTeMpxpzikEcZ8CFK5Npf8I6aOgJ9YkwIg1UJrName some of the common greenhouse gases.
Question 1.11
WXmw1fxX4mMhy/cxEKpXcjaUlCg3futJoiE/m6RrTepSefNi2. Carbon dioxide
Question 1.12
ug89YbSb1URjChTLFPi/rP7+4suVyAbZ1XEM81qnXH4vBBMXmLs7QQWHQ/vMtLbjvow67A==Describe the relationship between global temperature and carbon dioxide levels in the atmosphere for the last millennium.
Examine the graphs from Infographic 23.5; make sure to note the scale of time on the X axes.
Question 1.13
I0mLwMwWcQLQqXS3iSGFm2gW2ibue1afhzkm9KEIPbxdntXbtMWHJYIrk6DFRLqvNIHSEC6lJ5Ee7cg6VSGqiPxVCuBD166RCPb8xFL+j9shVgVtv4v4IQRPVJs=Question 1.14
npc7GhTLH490uWVctjSvA5cw6/CNBEZrGHCYXTvy+aP1kJkAbIWnKU03kp3qlrct4Vix5PE3GSlsD+NekcwH3LU3VFkUnomZLUGzLXlelqBpdWjhBoq3Z5WQKdiXFAqMcNBX6MN/bj+jlF1yxShOvgbfXY2zkovoq4BI3oA0zP4iGh8twvsyiaq/kBX2Cc9ZnY9mPH7ZaRep6FXKJzlAMKnbr704+i12TF/kVEcpvD+o4d5pvnn89VHvZydk37CzcEcKLOy7ePj5JbgSPlKT/6Xp3b9Inz1DY2ms8VJoEVCzkmAyC/+0ofvqueLholnFK8uuRTFypg85iRN5iADefcCiMb3DFCYDvw4xaSdhw/gL8V+luSZwfPuUhSdjq+M7sahraS6A1PbvZdPyTSrZd8ekySaCyiAxMlReJtVO6dN15yeZQuestion 1.15
y8M9aU9fT+kD3kqoXoK7/7Bt3dBcAnIsFZn+6ipXA58CtziMNNNYchO6cP2OsyYD8tAeLi3SlQfUlFE0TGoy/yS/D8KDZP/lvlmRI3MPmAVFA87emvYQ9H+iL6ems33F8P+9aiY13hTQ1HZxRbXjTDJsZ2/GimaBL/x8ENDqfwzv8GLNqmc8Qzt5kmoWCiBxOKTvgwM+f54dci92TwliXlg9GSxPJeDhhVT44WsoIlOimwcQj4JA0Hg0ZlQb4nskiiI8FUePjPNabZZpJWlRNLlmKhFlobOiJNrU1VRigzE8qcf0Ed0CZULRWGovT0KhList some of the methods used to estimate temperature and carbon dioxide levels in the past.
Question 1.16
bw0IK3j7RaHgjLozqsoKZ/jk31Ri7/QKLM+Uz5RnhBh2g28dBBmQz3K1a56mspsZHn0OmnqhWkncEhoDQuestion 1.17
Ykh0DBInaJI/PwSmUImQT3W968ozft1OK1jjgPfTV6V7PRgQvxRBoHk2f2Wl9hRYXtCrD8nZrGb9O+qQxkkHqqQXXpG6K7u8FdKQfjM5Rx/P225JxmO93K33HgHi6LUFyw8NfkWuXgy1DQz/UeafmA==Describe the changes in average temperature at the polar ice caps.
Question 1.18
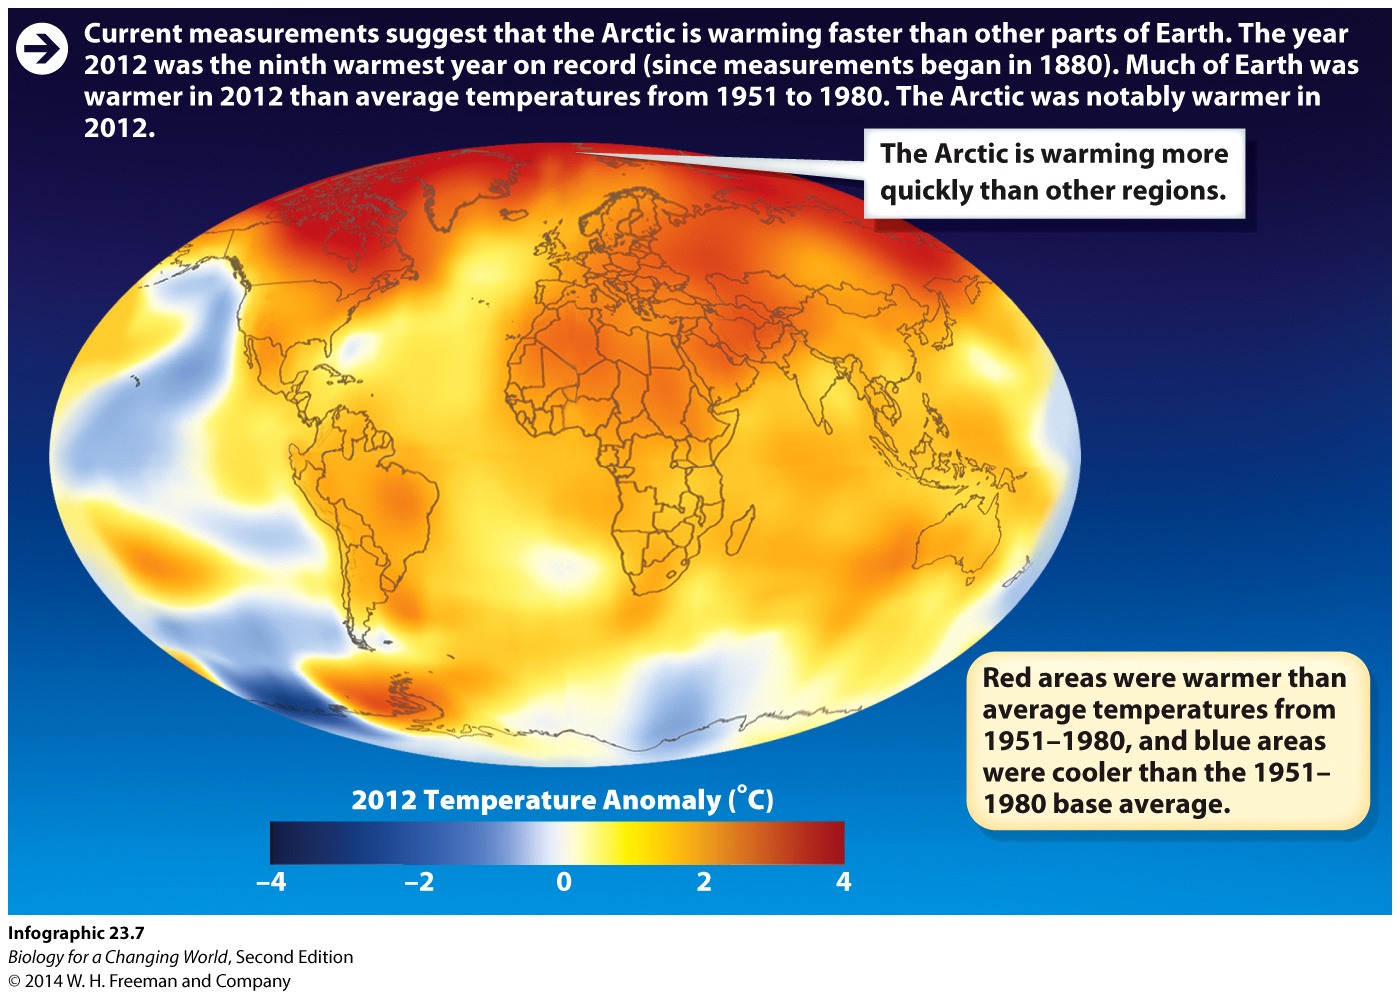
The map in Infographic 23.7 displays the changes in global temperature between the year(s) /5qxuCBevzs= and the year(s) 1Kln7Et3ymA=.
Question 1.19
1sF0FaQDVBMfK2THt+qXrgKbQEWN26nJK9i3nVRv6ZRvm6R4Y5rxNZQQ3I2p/ojL6l8k/8bjATPmft9KtQNs66MTNxXUNIG62xOwQViPvLqXCYowFMtwteS6Lqg=Question 1.20
WOlB76WuyfFSjeBizt7Ll04oS5g4RJIA8wTo3frIUH8GfiT+UK9zJkwHNUXGb0vVFrcCYC2OfLtsKr6Nj7iQFAheaDY=Question 1.21
18P/nMUW64S2lwH/oF3LKU5ifOSeq3zCbCe0PogSoBWlS2QImMKppDOVb4BKoDdWpQE2MA==Question 1.22
PsPh8d8S9+lcBu6GAla6aAkXesPCmF1z9XXj3SMroRRy+LL0csu7l7It+HYz8fws+JpUE22sf0Isrkr8E/DjrGvyDKc=Review Questions
Question 1.23
NBOc9dHWiRTWcuOxE/jaUriJ/qK9o2HHHcEHpNCoE7Ft5xwQIadt9yKN3cjTct7HIyOvajfHls9tQkXSZrbnHHwN5bkWfQaec6wZiBcQQbuEGIlETZq9/GDfpePwXbuNlbN1tKtCdrWDfFO1Wf53ur6ECFK2UTGZ4Hcza9+ZCfKKYGJDQ9nJDx3fGZJGAneHaytXSCAlin0K+fsIAKiTmHkqMFpBCGrfifTNV/XeBDh0O9gKrFuaWCbInjiRcKx0IFleCWrCoJOI7TfzQuestion 1.24
f6mQC5efPCLdWMN4flZsaIKWcJ7GTRG1thRLdqnY0FYFj7xXA2uoDdXFOtZ829Wmf4JDXSdWXAtBGi5jxtoPrcP0+srSI2I36dXeovvINuxhqf+Jaf/bkqjl9ecbFItQXInzID6fxRMY17Gwsp4PkqXFJAG7FrCUoS9veLO4dm7m9kaoLBOlAU6umPbcUauxGl5AT7IWNIZiaeewA+kWe8PM9jm90+kaHq9yj0eBuCE6Te8B/0itn7GNr6YmmkmFRmz0pR8Zd7GuWoP1bP/kqgaxZtqBMLR/Y0b/H59DEX6Znc4eSaUOp9QgpipaOHVGTSVK4Ncb0s2XuuQKJUJP6Q==1.4 Driving Question 3:
Driving Question 3
How do carbon and other chemicals cycle through ecosystems?
Why should you care?
Nowadays, terms like "carbon neutral" and "carbon footprint" get a lot of media time. Understanding the global carbon cycle is the best way to know what these terms mean.
It may be hard to get excited about nitrogen and phosphorus, especially since they largely cycle within soil. Nevertheless, the cycling of nitrogen and phosphorus are essential to the functioning of ecosystems and agriculture because, without them, plants wouldn't grow and animals wouldn't have food.
What should you know?
To fully answer this Driving Question, you should be able to:
- Explain what sources add carbon dioxide to the atmosphere.
- Explain what sources and processes remove carbon dioxide from the atmosphere.
- Explain how nitrogen transforms as it cycles within ecosystems.
- Explain how phosphorous transforms as it cycles within ecosystems.
Infographic Focus:
The infographics most pertinent to the Driving Question are 23.9 and Up Close: Chemical Cycles.
Explain what sources add carbon dioxide to the atmosphere.
Question 1.25
4E7ddcbu3skiF0fTQ25cGMoJq+7ffcvy91VMa5CRk5BglGC2ttZ+D+8Bv4e4p8Wm6/c5isFuOHbepQNPDold0Jx+flGXvTMt2. Deforestation
Question 1.26
Sd5dKla2Redi7dpn0zubnDxzMycEkbx/gXAfVsSf5xYlqpw8293cr6Vvz4iLbNM4Wi7JxQfnbwKwK3eJltSGZz7mbl/hckSgJQ0VIa9+ZS0xB66DwgSXCTOudwU=Question 1.27
H98Owee5u378riBoexGkigdL/gPMAg1Vt6Sp9gggmAc/XQ6qGwxA3JLdfkNlm9KbCTm/2n6xBvrIdEwQpdYeYZ8vLBYAc9ye6NRqNm3Qx63xB/5B7k9a7Mfnpm2uuDXr+Elcfepj8NW1sRJYRVQ4AA==Explain what sources and processes remove carbon dioxide from the atmosphere.
Question 1.28
XNG+xHvmt6UPV7gVszJMDCm3nd4OlsovfhWSSjPbZEL5tpjXsX7Z4NXohMQIMOm1JAjtLfN1n05aD3YkA6TBFw==Question 1.29
jz2Iox7nsfjccmjuFng5ZZuTNWMhuJzlAIq0BNUUbMrYVXdDEde2uNzXK3ZjB9my6xMuTTh1lwh+cubcPxwWduGinAXDXyGkDs5labyifDJGYqCNzcvIn3S0CPPWeL882NoAjr7k4+wIgxyMQ6Va8+duVYHAIsZdPOEvaA==Question 1.30
qDASiXY7ePR+aLSpIDQcJ41KwTTsQH/ddELSmslOUxlj+V6g4KYg5tsmr+A8yG2Xe2uGtw==Explain how nitrogen transforms as it cycles within ecosystems.
Question 1.31
Nitrogen gas makes up most (~70%) of the air we breathe, but it is not usable by organisms in that form. It must be converted or fixed into a different form in order to be used by plants, thus entering the food web and the nitrogen cycle of an ecosystem.
M5Syt76RIviq6NjaJHEZmv2wWSO8ug2SEZp2SN42lxBWdkbCzaZ5P2E0ke43o+Q6CQ+JPHogOcqk7puOlsHVFHbhsjZMSL2FKtWTqIEr1DY0KhkdQuestion 1.32
G3prR/18cE1Ix9bsCh7RoyFFMKI7vtrwCipgN0yoyy28IHwpLfX7hIYn3EKP3AgjdB9BKQpG3cA8mABBR5wh/KZzELXnp8FwUHLq4VNbxq8=Explain how phosphorous transforms as it cycles within ecosystems.
Question 1.33
Phosphorus is an essential part of bones, DNA, and RNA. It is usually found in nature in compounds called phosphates.
CGU0vO54nmWWrdQOjYhjZijZkg7GbZ5RTey2Pe3BPcWy4umkjNgH4yQMY1t6HySYJZBA5fLk91bY68VP0Ne8kg==Review Questions
Question 1.34
RlG2vjtHq+x6hYE22SSD1xR1AWmoKxxz8uaPQg4Arq37S5w+k8UUSVFq6gavcYQzB2QZRC76Tiq0wcWu4LmpgadxQOOjL6N4od8rd6BPL8mV90A1S6/LjQR8QkSlTI/RdwS012Gp/ITAj+PFSfnrOnUwpTkuiC5sI3bWbLprSoCygDgmI+YxDwx4x+XoX4H+nphrcG8oSHM2tttfqdcTw4ONmBkno5iC49dCiKZKxdtHZ/y1u6U1JQyNQuLYbVAPyVe0A0Ta+m0iiNsfGN08dlRidGiZrL6r/YhnJv8FFTnIvPpC3D7zJYR+az0fw5u2cKid16rwieP5uN7gmK0QRw==Question 1.35
/r1pnIvq2SokuZrI9oibZmD0y5B0TSzRYKwXizO9VUM/93JadZn3758XDXd5i1YDlZwvnR22vj0ZQxjw2U3fN/Pi1Cwl4H6y2hUY7MeHps0bJ0KIo9/wUmy2VNOv9OX3IlfSeCSaFXwES+ldur+GKUL32VZwmQISmlU+atT5Aq4jk2y76IhsAI4YIUHSuskKYOY3tSMqGpfB8REvRrRi7LyGC7Ohzlld/Y6LIQm52rRIKAyCKY5QRk2isvXWZmw2g6AFxS9PynF8/WhsgMCeGK5c6pMUXH6MI2N3t8w8z5YJX0a0YVsMwRFwXUEZ7z3/pUbb2Zc61rtVmV9V7wHeSyuwMur2z5zCfOXGOlrE2FHOlWhr4dpRjlvK4MtZXBwbACp8TVXoaafxkK5Yigr27Wz8+5EpesIT2agMgqHV/1N/xqPfo2emXYrT9BqhLHQbSvjsLGrZzGJby+zI0xHWvWtn0LAlCtTVCG9Ar/wxHwlfKV2h+qgkZEFw2rdInVWvA2EHrwVjteEUj4iady4o1BdetEbmQoH9LAjB1veH6PTU4tcVloELZKGOjF8L44YaA50knzkk3Evl6gdSz3ly76JiHsNY4e00WN+qvDlA5oMjbjUHoRsbdw1cMzTifRgL+T0LqVDCdgK8URT8yzVQjLfrqxrjDPQKje5Z/q2fVYNejH1Z6Rof0xRiSqEHu59z1.5 Driving Question 4:
Driving Question 4
How are scientists able to compare present-day levels of atmospheric carbon dioxide with past levels and why would they want to?
Why should you care?
Scientists have made inferences about previous levels of carbon dioxide and global temperature from several different lines of evidence. The accuracy of these inferences has been debated by those opposed to policy changes based on the assumption that global warming is an imminent, real problem.
How do your daily actions contribute to the emission of greenhouse gases? In other words, what is your carbon footprint?
Carbon dioxide is produced when organic compounds are burned. Evidence suggests that when humans started increasingly using coal, petroleum, and natural gas (all of which are organic compounds) for fuel about three hundred years ago, they began to increase atmospheric levels of carbon dioxide faster than it could be drawn out through the action of photosynthetic organisms. Methane—also a carbon compound—is a more potent greenhouse gas than carbon dioxide, and is produced by the decomposition of organic material by microorganisms living in anoxic conditions (e.g., the soil of a flooded rice paddy or the gut of a farm animal).
The coincidence of rising carbon dioxide levels and rising global temperatures lead some experts to urge governments to curtail the burning of fossil fuels, but there is much resistance to change since the world's energy system is based largely on fossil fuels.
What should you know?
To fully answer this Driving Question, you should be able to:
- Describe the methods used to establish carbon dioxide levels in the past.
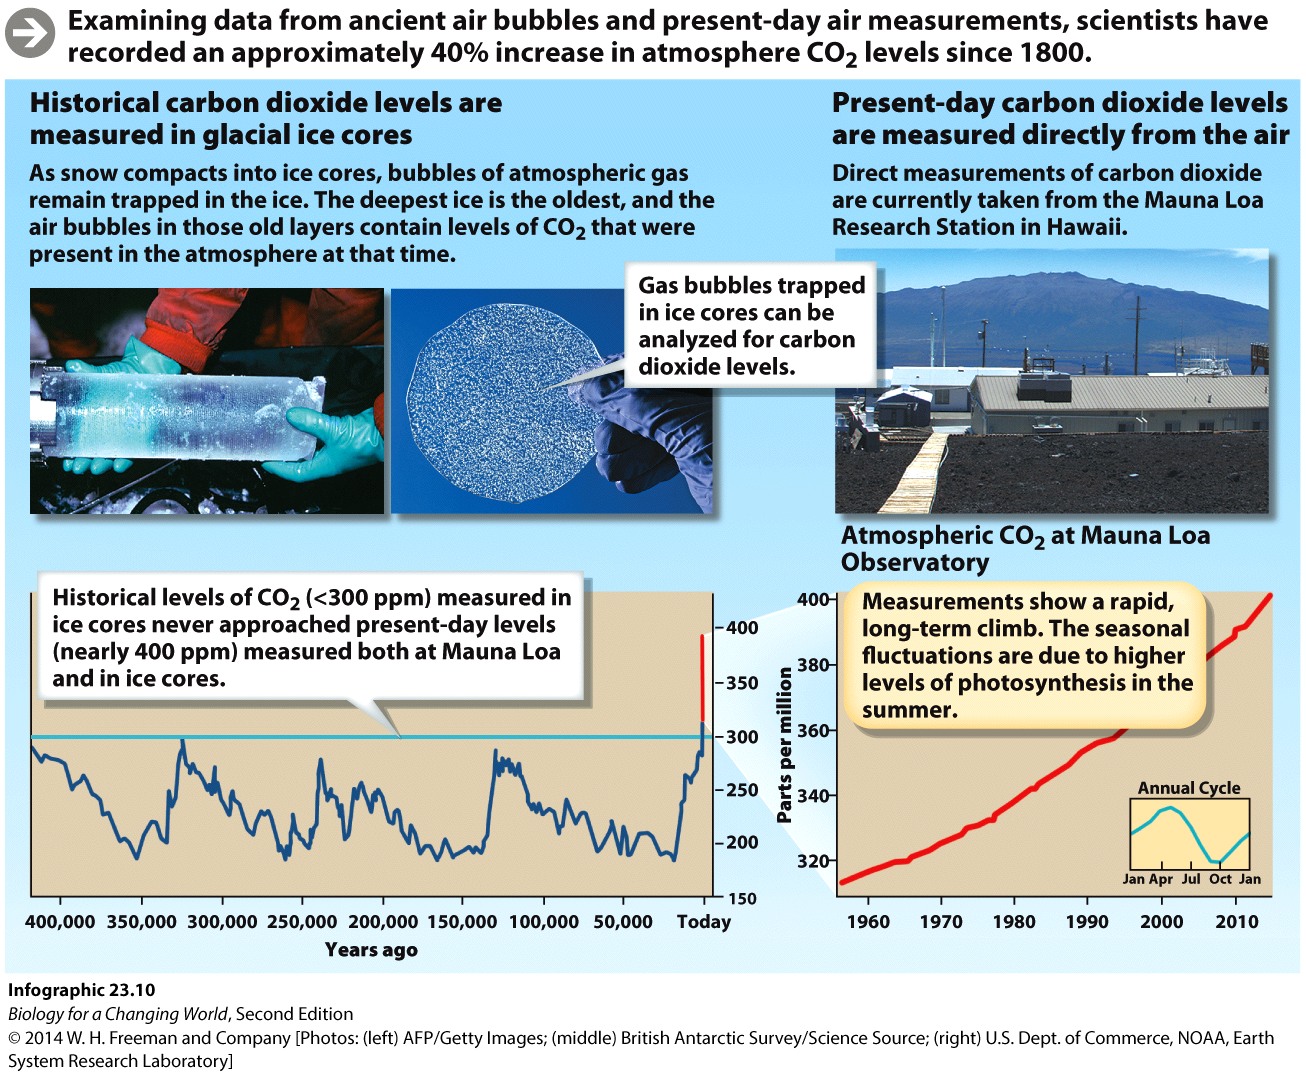
- Explain the seasonal variation in carbon dioxide levels measured directly from the atmosphere.
- Describe the historic and recent trends in atmospheric carbon dioxide level.
- Explain how various human activities increase atmospheric levels of greenhouse gases.
Infographic Focus:
The infographics most pertinent to the Driving Question are 23.5, 23.9, 23.10, and 23.11.
Describe the methods used to establish carbon dioxide levels in the past.
Question 1.36
wRrYoKLkOaexT6dmJQe4hVHFMhQku04CewXppe3iz0sxZa6Ggw8iPRrIFiOpBU9LyTAjnSZr5mT33Gqlr1yewnl3vKebYJrhKXMuddwzNeHrJx+lSm88X4Mizc57n4PhNyfl0x+P3Y+RGiNuCFv+sAOAKZiObr+TKsDMj+Ia1/8OuUnmR9yyduOqh72MASs+2j4TcB+gFrO0WkPWUEqiEj0lhSKZZ/hrR6+kbA7+ZeXc7O18rL+vLZHso6pKac6KExplain the seasonal variation in carbon dioxide levels measured directly from the atmosphere.
Question 1.37
Describe the historic and recent trends in atmospheric carbon dioxide level.
Question 1.38
Observe the graphs in Infographic 23.10 and answer the questions that follow.
+ZNbN0uzytAqfM0N+0OXjzxbT3YN9jg8lBdVUznNddv7ury2UqjQCcgpY1N0+udAdK063oOln5Lnt2b+CAWqAN6eGUzdIGYrsByN8iIH3xK7QZZk9WKkOOmgyYZR67YXlQ8EQF7R9FlKnvf/mLPb2A==Question 1.39
3b4zApc3VAJRwt4bG+WUNYbjuE6/k7Ns+QGcw1hqvBGlCT4qrkgG8AjOLWE+G7e5/1ZkfG0ZNw/9CNJ/EhKJFjRHUnC9rX9yjKi1g89zXTMN7jvwyszmWFsy58liCdud8H5LkhPOynuSRLy9gY9pI3/56jPqHR+RQuestion 1.40
mj92vTjW6wdZ7SI/7hl22maY3MHZ0gRm5mkJ2lVtgfsAGzHORJACs9maJ7M=Thought Question: The historical cycling of carbon dioxide before 1800 correlated with ice ages. Why might this be, and do you think carbon dioxide levels were at their highest or lowest level in the cycle at the start of an ice age?
Explain how various human activities increase atmospheric levels of greenhouse gases.
Question 1.41
For each activity below, explain how it adds greenhouse gases to the atmosphere. Note that some activities, like farming, may add more than one kind of gas to the atmosphere, and some activities add gases indirectly by supporting activities that add greenhouse gases directly.
P5lbK7Ivqc2TP2sarTMC3hq3rDHzREPXnYEY+kZkmkUvJsjrWLL5/KneFNA= 6J5amMzdQvnKbIX0cuyO7pF/mJwe2hq6wDlpz7tdS9ZWZTp3GsV7gQ== ub5rB9jW/36ltWaiEAow8g== WQBLnyKZs6hnrn4+8o1Y9JVAjVaJkgJj4CtQNLIcPs0= mb2ZFMuiZjuXmFyjroYa7gp2m/LblpBpw/ufLZIcpXGZ5nh+rVo4ofPce/ZKAU1gxCxLVg==Greenhouse gases emitted by the burning of fossil fuels by the airplane used to get to the Caribbean.
• Ordering a steak at a restaurant:
Supporting the farming of cattle, which produce methane, and the processing of the meat with machines that require the burning of fossil fuels. Also, cattle eat plants, which reduces the number of photosynthetic organisms available to convert carbon dioxide into oxygen.
• Eating rice:
Large quantities of methane are produced through the farming of rice in paddies. Also, the processing of rice requires the burning of fossil fuels and the removal of the living plant once again reduces the number of photosynthetic organisms.
• Erecting a large building:
The process of obtaining the materials, both living and nonliving, building, and running the building will all require the burning of fossil fuels. Also, if wood is used in the building, that means that trees were cut down and now are unable to convert carbon dioxide into oxygen.
• Buying lumber that has not be grown sustainably:
The process of cutting and transporting the lumber requires the burning of fossil fuels, and the fact that the trees are now gone and unable to photosynthesize results in less organisms taking carbon dioxide out of the atmosphere.
Review Questions