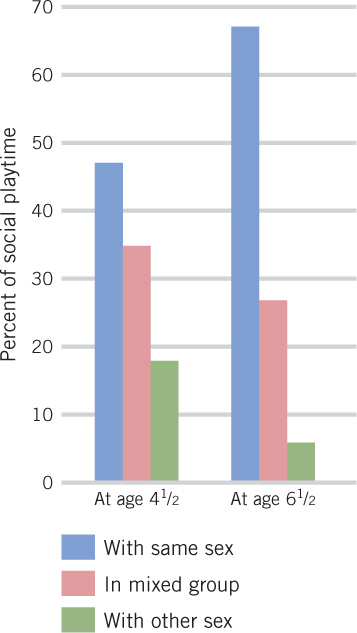
FIGURE 15.2 Gender segregation in play This graph reflects the increase in social playtime between preschool and 1st grade that children spent with playmates of their own gender and the decrease in playtime with playmates of the other gender. (Adapted from Maccoby, 1998)