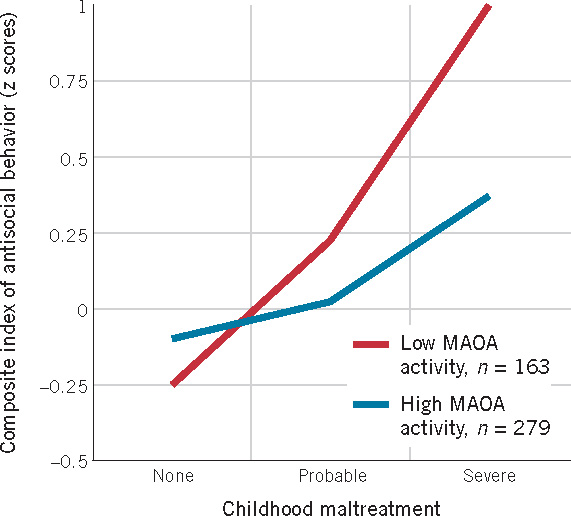
FIGURE 3.5 Genotype and environment This graph shows the level of antisocial behavior observed in young men as a function of the degree to which they had been maltreated in childhood. As this figure shows, those young men who had experienced severe maltreatment were in general more likely to engage in antisocial behavior than were those who had experienced none. However, the effect was much stronger for those individuals who had a relatively inactive MAOA gene. (Adapted from Caspi et al., 2002, p. 852)