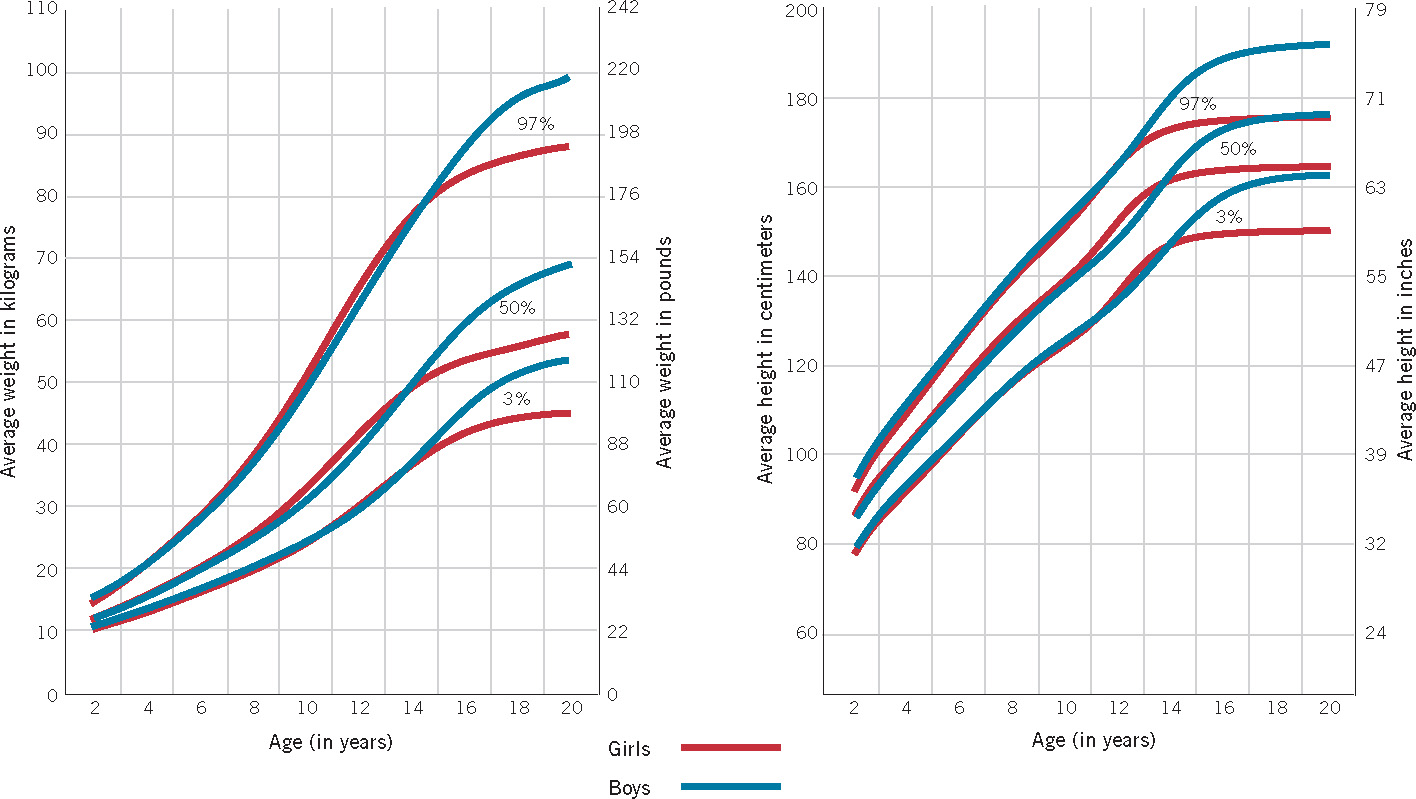
FIGURE 3.11 Growth curves These growth curves for height and weight from ages 2 to 20 years are based on large national samples of children from across the United States. Each curve indicates the percent of the reference population that falls below the indicated weight and height.(Centers for Disease Control and Prevention, 2002)