Measuring Intelligence
Although intelligence is usually viewed as an invisible capacity to think and learn, any measure of it must be based on observable behavior. Thus, when we say that a person is intelligent, we mean that the person acts in intelligent ways. One of Binet’s profound insights was that the best way to measure intelligence is by observing people’s actions on tasks that require a variety of types of intelligence: problem solving, memory, language comprehension, spatial reasoning, and so on. Modern intelligence tests continue to sample these and other aspects of intelligence.
Intelligence testing is highly controversial. Critics such as Ceci (1996) and Sternberg (2008) argue that measuring a quality as complex and multifaceted as intelligence requires assessing a much broader range of abilities than are assessed by current intelligence tests; that current intelligence tests are culturally biased; and that reducing a person’s intelligence to a number (the IQ score) is simplistic and ethically questionable. In contrast, advocates (e.g., Gottfredson, 1997; J. L. Horn & McArdle, 2007) argue that intelligence tests are better than any alternative method for predicting important outcomes such as school grades, achievement test scores, and occupational success; that they are valuable for making decisions such as which children should be given special education; and that alternative methods for making educational decisions, such as evaluations by teachers or psychologists, may be subject to greater bias. Knowing the facts about intelligence tests and understanding the issues surrounding their use is crucial to generating informed opinions about these issues.
302
The Contents of Intelligence Tests
Intelligence is reflected in different abilities at different ages. For example, language ability is not a part of intelligence at 4 months of age, because infants this young neither produce nor understand words, but it is obviously a vital part of intelligence at 4 years of age. The items on tests developed to measure intelligence at different ages reflect these changing aspects. For instance, on the Stanford-Binet intelligence test (a descendant of the original Binet-Simon test), 2-year-olds are asked to identify the objects depicted in line drawings (a test of object recognition), to find an object that they earlier had seen hidden (a test of learning and memory), and to place each of three objects in a hole of the proper shape (a test of perceptual skill and motor coordination). The version of the Stanford-Binet presented to 10-year-olds asks them to define words (a test of verbal ability), to explain why certain social institutions exist (a test of general information and verbal reasoning), and to count the blocks in a picture in which the existence of some blocks must be inferred (a test of problem solving and spatial reasoning).
Intelligence tests have had their greatest success and widest application with children who are at least 5 or 6 years old. The exact abilities examined, and the items used to examine them, vary somewhat from test to test, but there is also considerable similarity among the leading tests.
Wechsler Intelligence Scale for Children (WISC) widely used test designed to measure the intelligence of children 6 years and older
The most widely used intelligence testing instrument for children 6 years and older is the Wechsler Intelligence Scale for Children (WISC). The current edition, the WISC-IV, was revised in 2003 to reflect modern theoretical conceptions of intelligence and the current population of children in the United States, which is more diverse, both linguistically and culturally, than it was when the WISC was previously revised in the 1990s.
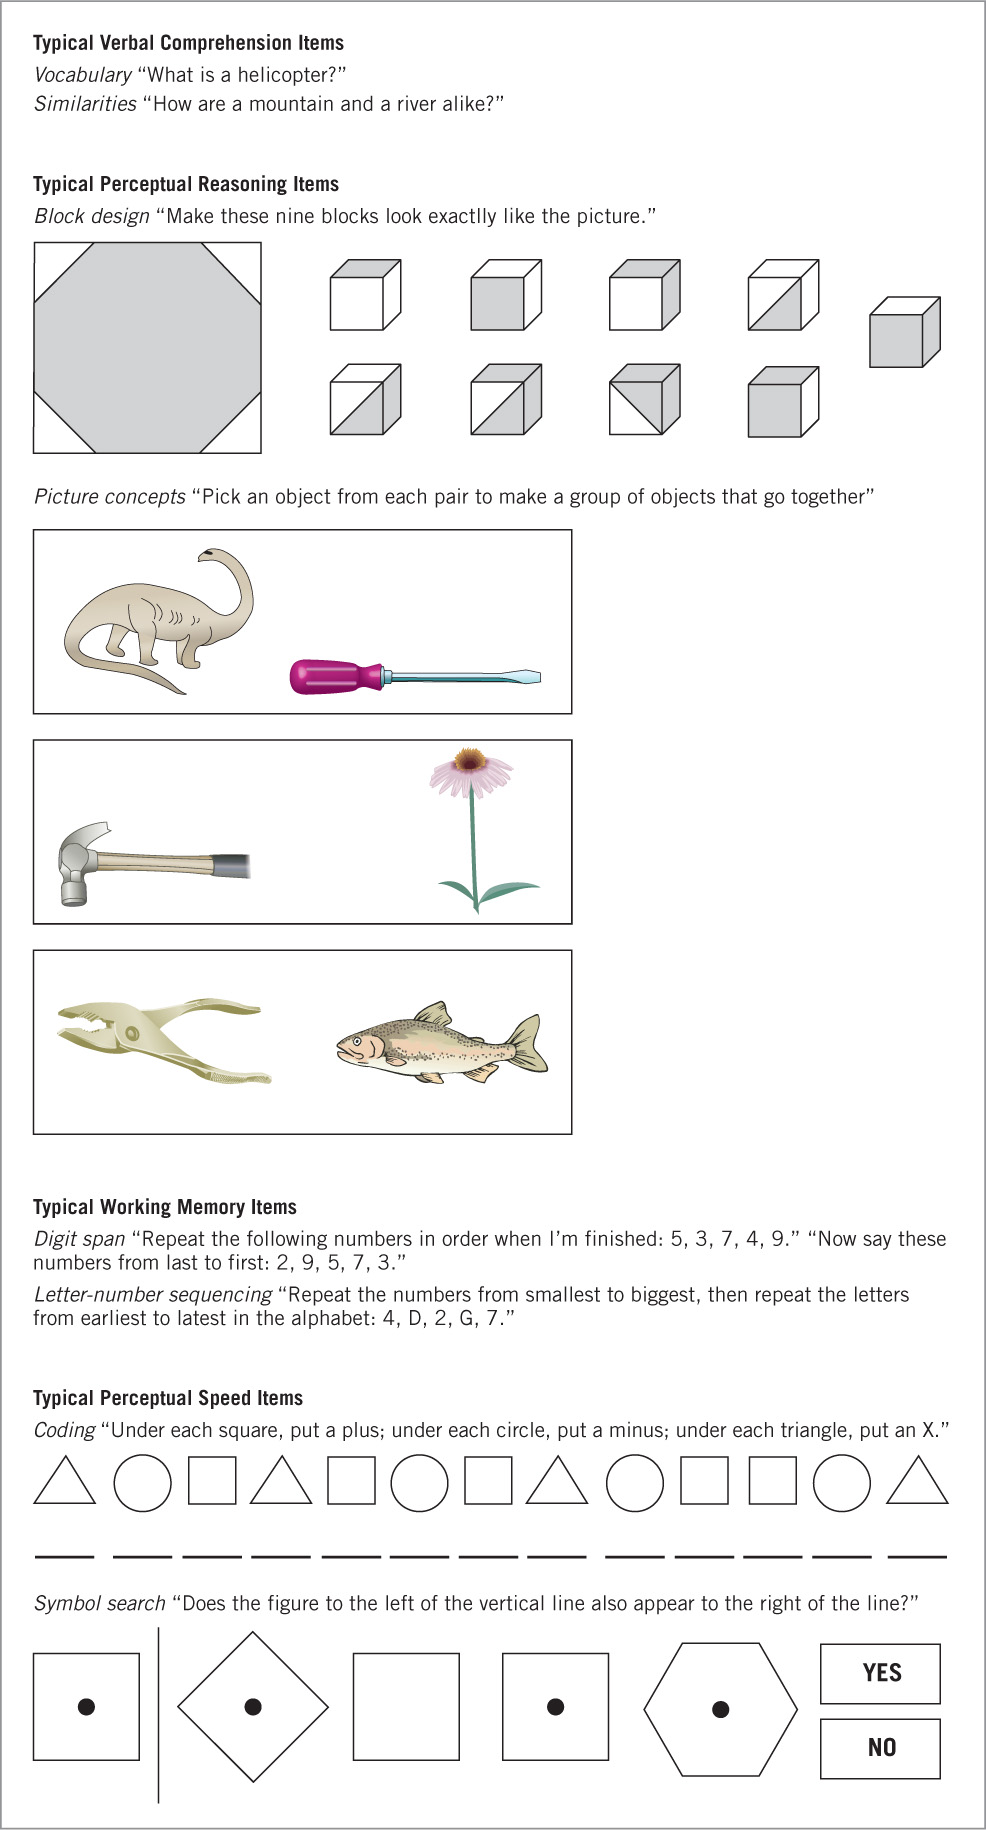
The conception of intelligence underlying the WISC-IV is consistent with Carroll’s three-stratum framework, proposing that intelligence includes general ability (g), several moderately general abilities, and a large number of specific skills. The test yields not only an overall score but also separate scores on four moderately general abilities—verbal comprehension, perceptual reasoning, working memory, and processing speed. The WISC-IV measures these abilities because they reflect skills that are important within information-processing theories, correlate positively with other aspects of intelligence, and are related to important outcomes, notably school grades and later occupational success (Flanagan & Kaufman, 2004). Figure 8.2 provides examples of the four types of items that appear on the WISC-IV (the actual items are protected by copyrights and thus cannot be reprinted).
303
304
The Intelligence Quotient (IQ)
IQ (intelligence quotient) quantitative measure, typically with a mean of 100 and a standard deviation of 15, used to indicate a child’s intelligence relative to that of other children of the same age
Intelligence tests such as the WISC and the Stanford-Binet provide an overall quantitative measure of a child’s intelligence relative to that of other children of the same age. This summary measure is referred to as the child’s IQ (intelligence quotient).
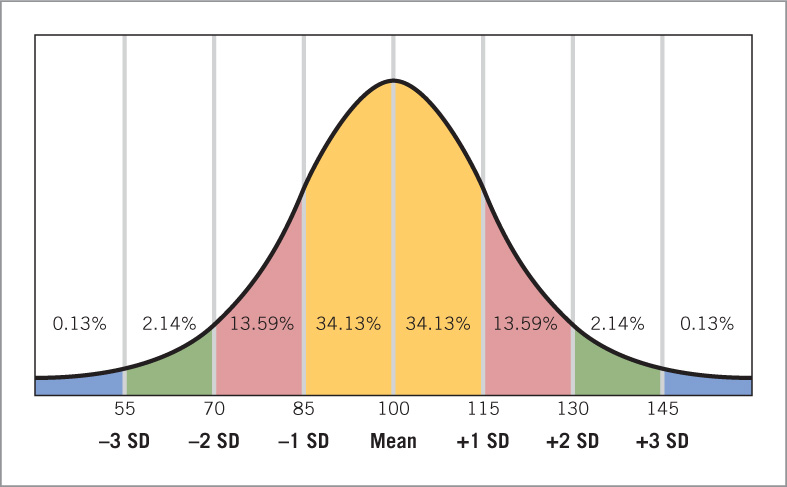
Understanding how IQ scores are computed, and why, requires a little background. Early developers of intelligence tests observed that many easy-to-measure human characteristics, such as men’s heights, women’s heights, men’s weights, and women’s weights, fall into a normal distribution. As shown in Figure 8.3, normal distributions are symmetrical around a mean (average) value, with most scores falling relatively near the mean. The farther a score is from the mean, the smaller the percentage of people who obtain it. For example, the mean height of adult males in the United States is around 5 feet 10 inches. Many men are 5 feet 9 inches or 5 feet 11 inches, but few men are 5 feet 2 inches or 6 feet 6 inches. The farther from the mean a height falls, the smaller the number of men of that height.
normal distribution pattern of data in which scores fall symmetrically around a mean value, with most scores falling close to the mean and fewer and fewer scores farther from it
Similarly, the normal distribution found in intelligence test scores of children of a given age means that most IQ scores are fairly close to the mean, with few children obtaining very high or very low scores. Early designers of IQ tests made an arbitrary decision that has been maintained ever since: a score of 100 is given to children who score exactly at the mean for their age at the time the test is developed. (The mean score can rise or fall in the years after a particular test is developed and, indeed, as discussed later in this chapter, IQ scores on specific tests have risen throughout the industrialized world over the past century.)
standard deviation (SD) measure of the variability of scores in a distribution; in a normal distribution, 68% of scores fall within 1 SD of the mean, and 95% of scores fall within 2 SDs of the mean
IQ scores reflect not only the mean for the test but also its standard deviation (SD), a measure of the variability of scores within a distribution. By definition, in a normal distribution, 68% of scores fall between 1 SD below the mean and 1 SD above it, and 95% of scores fall between 2 SDs below the mean and 2 SDs above it.
On most IQ tests, the standard deviation is about 15 points. Thus, as shown in Figure 8.3, a child scoring 1 standard deviation above the mean for his or her age (a score higher than 84% of children) receives a score of 115 (the mean of 100 plus the 15-point SD). Similarly, a child scoring 1 standard deviation below the mean (a score higher than only 16% of children) receives a score of 85 (the mean of 100 minus the SD of 15). Figure 8.3 also reflects the fact that about 95% of children obtain IQ scores that fall within 2 standard deviations of the mean (between 70 and 130).
305
An advantage of this scoring system is that IQ scores at different ages are easy to compare, despite the great increases in knowledge that accompany development in all children. A score of 130 at age 5 means that a child’s performance exceeded that of 98% of age peers; a score of 130 at age 10 or 20 means exactly the same thing. This property has facilitated analysis of the stability of individuals’ IQ scores over time, a topic we turn to next.
Continuity of IQ Scores
If IQ is a consistent property of a person, then the IQ scores that people obtain at different ages should be highly correlated. Longitudinal studies that have measured the same children’s IQ scores at different ages have, in fact, shown impressive continuity from age 5 onward. For example, one study indicated that children’s IQ scores at ages 5 and 15 correlated 0.67 (Humphreys, 1989). This is a remarkable degree of continuity over a 10-year period. (Recall from Chapter 1 that a correlation of 1.00 indicates that two variables are perfectly correlated.) Indeed, the IQ score may be the most stable of all psychological traits (N. Brody, 1992).

Several variables influence the degree of stability of IQ scores over time. As might be expected, the closer in time that IQ tests are given, the more stability is found. Thus, the same study that found that IQ scores at ages 5 and 15 correlated 0.67 also found that scores at ages 5 and 9 correlated 0.79 and at ages 5 and 6 correlated 0.87. In addition, for any given length of time between tests, scores are more stable at older ages. For instance, in one study, IQ scores of 4- and 5-year-olds correlated 0.80, those of 6- and 7-year-olds correlated 0.87, and those of 8- and 9-year-olds correlated 0.90 (N. Brody, 1992).
Although a person’s IQ scores at different ages tend to be similar, the scores are rarely identical. Children who take an IQ test at age 4 and again at age 17 show an average change, up or down, of 13 points; those who take the test at ages 8 and 17 show an average change of 9 points; and those who take it at ages 12 and 17 show an average change of 7 points (N. Brody, 1992). These changes are due at least in part to random variation in factors such as the child’s alertness and mood on the test days. Changes in the child’s environment, such as those associated with parental divorce or remarriage or moving to a better or worse neighborhood, also can produce changes in IQ score (Sameroff et al., 1993).
A question of interest to parents and scientists alike is whether it is possible to identify at young ages children who are superior in intelligence or in specific intellectual or artistic abilities. Research on such children, who are often described as “gifted,” is presented in Box 8.1.
306
Box 8.1: individual differences: Gifted Children
KyLee was already fascinated by numbers at age 18 months. His favorite toys were plastic numbers and blocks with numbers on them. As he played with these toys, he said the number names over and over. When he was 2 years old, he saw a license plate with two 8s on it and said “8 + 8 = 16.” Neither he nor his parents could explain how he knew this. By age 3 years, KyLee was playing math games on a computer every day. During one such game, he discovered the idea of prime numbers and thereafter was able to identify new prime numbers. Again, neither he nor his parents knew how he did this.
Before he entered kindergarten, KyLee could add, subtract, multiply, divide, estimate, and solve complex word problems. When asked if he ever got tired of numbers, he said, “No, never” and said that he was a “number boy” (Winner, 1996, pp. 38–39). He went on to represent his state in the national MATHCOUNTS competition when he was a 7th grader, is now majoring in computer science at an Ivy League university, and plans on devoting his career to improving the efficiency of everyday life activities through the development of superior algorithms (E. Winner, personal communication, December 26, 2012).
As noted by Ellen Winner, a psychologist who studies intellectually and artistically gifted children, most, like KyLee, show astonishing early facility in a single area: numbers, music, drawing, reading, or some other realm. A smaller number of children are exceptional over a wide range of intellectual areas. These globally gifted children usually display several signs of giftedness from very early in development (N. M. Robinson & Robinson, 1992):
 Unusual alertness and long attention span in infancy
-
Rapid language development
-
Curiosity—asking deep questions and being dissatisfied with superficial answers
-
High energy levels, often bordering on hyperactivity
-
Intense reactions to frustration
-
Precocious reading and interest in numbers
-
Exceptional logical and abstract reasoning
-
Unusually good memory
-
Enjoyment of solitary play

Exceptional early ability often foreshadows outstanding later achievement. Consider a long-term study of 320 children who took the SAT by age 13 as part of a national talent search and who scored in the top 1 in 10,000 in verbal or math ability. Among their accomplishments by age 23 were adapting Pink Floyd’s The Wall into a multi media rock opera, developing one of the most popular video games in the United States, and inventing a navigation system that was used to land a rocket on Mars (Lubinski et al., 2001). As a group, they had published 11 articles in scientific and medical journals and won numerous major awards in areas ranging from physics to creative writing.
By age 33, more than half of the original sample had received a PhD, MD, or JD (Lubinski et al., 2006). Their rate of PhDs was more than 50 times higher than that for the general population, and their rate of patents was 11 times that in the general population. Even within this elite sample, higher initial SAT mathematics scores predicted higher achievement. For example, the higher the score on the SAT math test at age 13, the greater the number of patents and publications in scholarly journals—especially those in science, engineering, and mathematics—at age 33 (Park, Lubinski, & Benbow, 2008).
Exceptional early ability in an area is no guarantee of outstanding adult achievement in it. Factors such as creativity, devotion to the area, ability to work long hours, and perseverance in the face of difficulty are also essential for making exceptional contributions (Lubinski & Benbow, 2006; Wai et al., 2010). Nonetheless, it is remarkable how scores on a single test, given at age 13 years, predict exceptional achievement 20 years later.
review:
Intelligence tests examine a range of abilities and types of knowledge, including vocabulary, verbal comprehension, arithmetic, memory, and spatial reasoning. The tests are used to obtain a general measure of intelligence: the IQ score. IQ tests are designed to produce average scores of 100, with higher scores indicating above-average intelligence and lower scores below-average intelligence. After age 5 or 6, IQ scores of individual children tend to be quite stable over long periods, but they vary somewhat from one testing to the next.
307