15.7 Chapter 15 Exercises
Question 15.18
Staph infections. A study investigated ways to prevent staph infections in surgery patients. In a first step, the researchers examined the nasal secretions of a random sample of 6771 patients admitted to various hospitals for surgery. They found that 1251 of these patients tested positive for Staphylococcus aureus, a bacterium responsible for most staph infections.10
- (a) Describe the population and explain in words what the parameter p is.
- (b) Give the numerical value of the statistic
 that estimates p.
Question 15.19
Texting. In 2012, about 85% of American adults owned a cell phone, and the percent of cell phone owners who used their cell phone to send or receive text messages was at an all-time high of 80%.11 A polling firm contacts an SRS of 1200 people chosen from the population of cell phone owners.
- (a) What are the mean and standard deviation of
, the proportion of cell phone owners in the sample who use their cell phone to text?
- (b) What is the approximate probability that
is between 78% and 82%? This is the probability that
estimates p within 2%.
Question 15.20
Statistics anxiety. What can teachers do to alleviate statistics anxiety in their students? To explore this question, statistics anxiety for students in two classes was compared. In one class, the instructor lectured in a formal manner, including dressing formally. In the other, the instructor was less formal, dressed informally, was more personal, used humor, and called on students by their first names. Anxiety was measured using a questionnaire. Higher scores indicate a greater level of anxiety. The mean anxiety score for students in the formal lecture class was 25.40; in the informal class the mean was 20.41. For each of the boldface numbers, indicate whether it is a parameter or a statistic. Explain your answer.
346
Question 15.21
Texting, continued. In 2012, about 85% of American adults owned a cell phone with the percent of cell phone owners who used their cell phone to send or receive text messages at an all-time high of 80%. A polling firm plans to contact an SRS of people chosen from the population of cell phone owners. You want the proportion
of cell phone owners in the sample who use their cell phone to text, to estimate p with an error of no more than 2% in either direction. That is, you want
to be between 78% and 82%.
- (a) What standard deviation must
have so that 99.7% of all samples give a
within 2% of p? (Hint: Using the 68–95–99.7 rule, how many standard deviations does 2% need to equal for the interval between 78% and 82% to contain 99.7% of all sample values of
? How large must the standard deviation of
be to achieve this?)
- (b) How large an SRS do you need to reduce the standard deviation of
to the value you found in part (a)? This is the number of observations that you need so that the sample proportion
will estimate p with an error of no more than 2% in either direction. We will return to this type of sample size calculation in the next chapter.
Question 15.22
Roulette. A roulette wheel has 38 slots, of which 18 are black, 18 are red, and 2 are green. When the wheel is spun, the ball is equally likely to come to rest in any of the slots. One of the simplest wagers chooses red or black. A bet of $1 on red returns $2 if the ball lands in a red slot. Otherwise, the player loses his dollar. When gamblers bet on red or black, they need to win more than 50% of their wagers to have a winning day. Because of the two green slots, the probability of winning when a gambler bets on red is 18/38 = 47.4%. Explain what the law of large numbers for proportions tells us about the chance of having a winning day if a gambler makes very many bets on red.

Question 15.23
Sampling voters. Your state representative is planning on supporting a bill legalizing same-sex marriage in your state and wants to estimate the proportion of voters in her district who support this bill. She mails a survey to an SRS of 1300 registered voters in her district, and 800 surveys are returned. In her district, 54% of the registered voters are female.
- (a) What is the population for this survey?
- (b) What is the sample for this survey?
- (c) Treating the 800 respondents as an SRS from her district, what is the probability that the proportion of females among the respondents differs from the proportion of registered female voters in her district by more than 5%?
Question 15.24
Sampling voters, continued. In the previous exercise, suppose that in the sample of 800 surveys returned to your state representative, 528 are from female voters.
- (a) What is the sample proportion
of females that responded to the survey? Using your results from Exercise 15.23, if the 800 returned surveys were an SRS, do you feel that the difference between the proportion of female voters that responded to the survey and the population proportion of 54% can be easily explained by chance variation? If not, what is an alternative explanation for the high proportion of female respondents?
- (b) Among the 800 surveys that are returned, 72% support the bill. If women are more likely to support the bill legalizing same-sex marriage than men, what would be the direction of the bias in the estimate? Explain your answer.
Question 15.25
 Online shopping. Over a typical quarter of the year, about 75 million people, or one-third of the total Internet population, buy goods online to be shipped to them. Of those, approximately 67% select Economy Ground shipping, which takes 5–7 days.12 A survey of 1200 online shoppers is to be taken. What is the probability that the proportion of shoppers in the sample who select Economy Ground shipping for their order is larger than 70%? Use the four-step process to guide your work.
Question 15.26
Too close to call! In the 2012 Presidential election, Florida was one of the swing states in which no single candidate or party had overwhelming support. In a poll completed November 1, just one week before the election, the Tampa Bay Times found 51% in favor of Romney, 45% in favor of Obama and 4% undecided. On November 3, the opening line in the article of the Tampa Bay Times that reported the results of this poll said “Florida continues to look good for Mitt Romney.”13 The poll was based on a sample of 800 likely voters. On election day, Romney received 49.1% of the votes in Florida and lost the state. What happened?
- (a) For each of the boldface numbers, indicate whether it is a parameter or a statistic. Explain your answer.
- (b) Suppose 49.1% of all voters supported Mitt Romney at the time of the poll. What are the mean and standard deviation of
, the proportion of voters in a SRS of 800 voters who would support Romney?
- (c) Suppose 49.1% of all voters supported Mitt Romney at the time of the poll. What is the probability that at least 51% of the voters in an SRS of 800 voters would support Romney?
Polls conducted by NBC News and Public Policy Polling in the same week showed Obama in the lead in Florida. In a very close election, be careful not to overinterpret the results from a single poll. Unfortunately chance variation doesn’t make an interesting headline!
347
Question 15.27
Sex and social networking. Although women tend to visit social-networking sites somewhat more frequently than men, the recent social media phenomenon Pinterest is an extreme example with 83% of the users being female in the United States. The usage is so one-sided that Time declared “Men are from Google+, Women are from Pinterest.”14 An SRS of 500 Pinterest users is to be taken.
- (a) What are the mean and standard deviation of
, the proportion of Pinterest users in the sample that are female?
- (b) What is the approximate probability that
is between 80% and 86%? This is the probability that
estimates p within 3%.
Question 15.28
Greeks lead the world in pessimism. Greeks bucked a global trend in which people in most countries expect their lives in five years to be better than their current lives. Even among those countries with much lower current life ratings, greater optimism was found because people cannot fathom their lives getting worse. But in Greece, only 25% expect their lives to be better in five years than currently, possibly reflecting the government’s debt crisis and the political and economic uncertainty in the country.15 In an SRS of 500 Greek citizens, what is the probability that less than 30% of the sample expect their lives in five years to be better than their current lives?

Question 15.29
Sex and social networking, continued. Although women tend to visit social-networking sites more frequently than men, the recent social media phenomenon Pinterest is dominated by women, with 83% of the users being female in the United States. The usage is so one-sided that Time declared “Men are from Google+, Women are from Pinterest.” An SRS of Pinterest users is to be taken, and you want your sample proportion
to estimate p with an error of no more than 3% in either direction, or
to be between 80% and 86%.
- (a) What standard deviation must
have so that 95% of all samples give a
within 3% of p?
- (b) How large an SRS do you need to reduce the standard deviation of
to the value you found in part (a)?
Question 15.30
Car colors on campus. Approximately 20% of cars in the United States are white. You take an SRS of 300 cars parked in student lots on your campus and find that 42 are white. For this problem, you can assume that you have obtained an SRS of student cars on campus.
- (a) What is the proportion,
, of white cars in your sample?
- (b) If 20% of student cars on campus are white, what proportion of samples would give a value of
as small as the value computed in (a)?
- (c) There are two explanations for your sample result. The first is that you obtained a sample with an unusually low percentage of white cars. What is an alternative explanation?
!web! Exploring the Web
Question 15.31
Health care access/coverage. The Behavioral Risk Factor Surveillance System (BRFSS) is an ongoing data collection program designed to measure behavioral risk factors for the adult population (18 years of age or older) living in households. Data are collected from a random sample of adults (one per household) through a telephone survey. Go to the Web site apps.nccd.cdc.gov/BRFSS/, and, using the most recent year, under “Category” go to “Health Care Access/Coverage.” Under the topic “Adults aged 18–64 who have any kind of health care coverage,” you will find the percent with coverage in each state.
- (a) Which state has the highest percent of coverage, and what is the reported value? Which state has the lowest percent, and what is its value? Are the reported percents statistics or parameters?
- (b) Choose a state of interest to you, and click on the link. In the table that opens, there is a line for n, and the entries are the numbers who answered “Yes” and “No.” Find the percent in the sample who answered “Yes.” Notice that it is different from the percent reported in the table. The table estimates are weighted to try to reduce bias. If it is determined that certain portions of the population are underrepresented in the sample, then that portion of the sample receives more weight when computing the estimate of the percent. The assumptions for an SRS are rarely met in practice, and more complicated methods are often necessary to estimate proportions.
348
Question 15.32
More on weighting of estimates. The Web site for the American Association for Public Opinion Research discusses several issues about polls. Read the discussion of weighting at www.aapor.org/Weighting1.htm. The necessity of weighting arises in Exercises 15.23 and 15.24 (page 346). Here are the important points from these exercises.
A state representative wants to estimate the proportion of voters in her district who support a bill legalizing same-sex marriage. In her district, it is known that 54% of the registered voters are female. She mails a survey to an SRS of 1300 registered voters, and 800 surveys are returned. Among the 800 surveys returned, over 65% were from women, and the women tended to support the bill more than the men. Because the women are both overrepresented in the sample compared with the population and they also have stronger support for the bill, the proportion in the sample that support the bill will tend to be larger than in the population, producing bias in the estimate.
- (a) The online discussion of weighting gives three uses of weighting to adjust poll results. Which of these three uses is relevant in this situation?
Here is a breakdown of the respondents.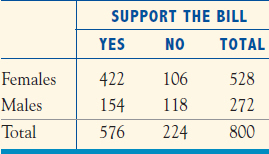
- (b) What is the proportion of females in the sample,
F, that support the bill and the proportion of males in the sample,
M, that support the bill?
- (c) If the sample proportions
F and
M were equal to the true proportions of females and males that support the bill, what would be the true proportion of all registered voters in the population who support the bill? This is a weighted estimator. (Hint: You will need to use the fact that 54% of the population is female and 46% is male in your computation.)
- (d) The weighted estimator is smaller than the unweighted estimator
= 576/800 = 0.72. Why is this the correct direction to adjust the estimator?