11-5 Low-mass stars pulsate and eject planetary nebulae, leaving behind a white dwarf at the end of their life cycles
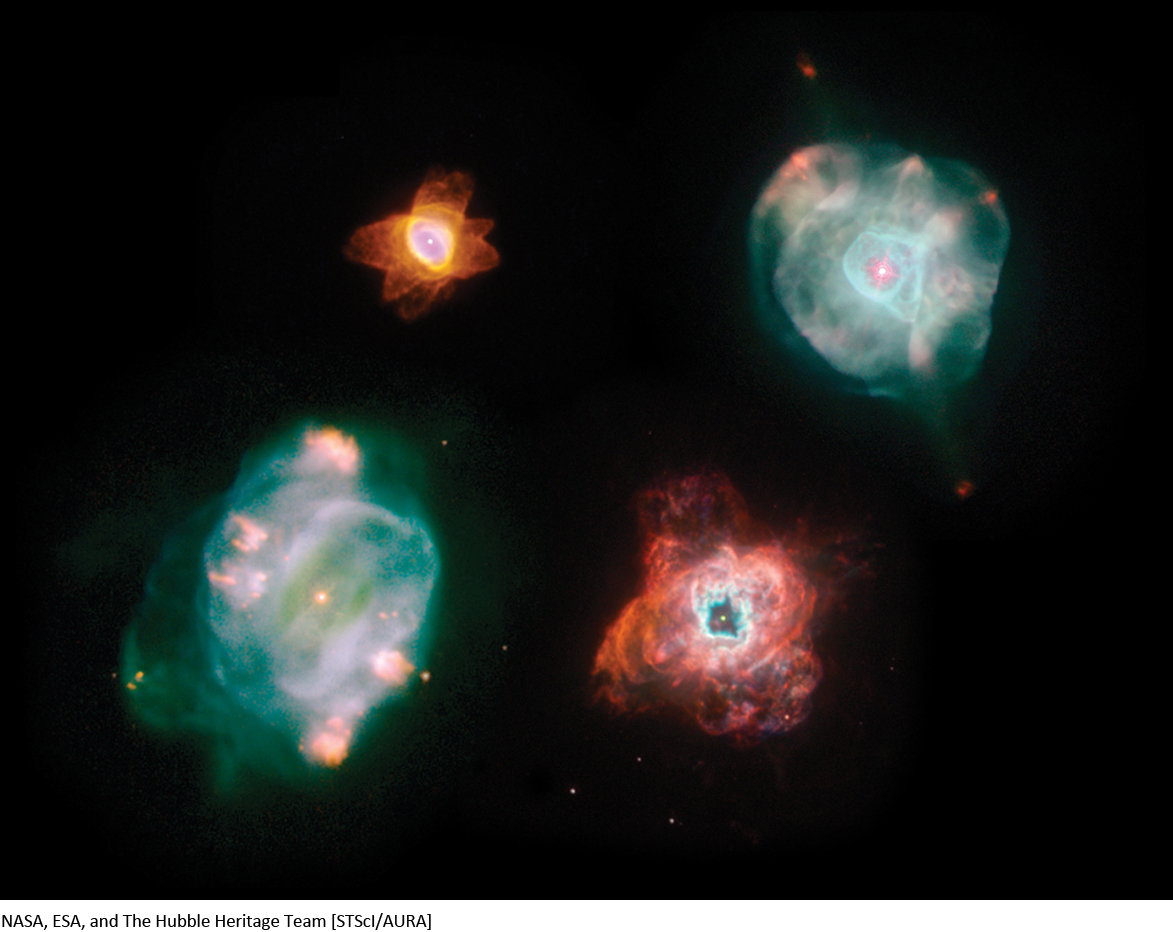
For a star that began with a moderately low mass (between about 0.4 M⊙ and 4 M⊙), the AGB stage in its evolution is a dramatic turning point. Before this stage, a star loses mass only gradually through steady stellar winds. But as it evolves during its AGB stage, a star divests itself completely of its outer layers. The aging star undergoes a series of bursts in luminosity, and in each burst it ejects a shell of material into space. Eventually, all that remains of a low-mass star is a fiercely hot, exposed core, surrounded by glowing shells of ejected gas. This late stage in the life of a star is called a planetary nebula. Figure 11-23 shows the wide variety observed in planetary nebula, often given names reflective of their shapes.
270
Question
ConceptCheck 11-16: How many planets make up a planetary nebula?
Making a Planetary Nebula
To understand how an AGB star can eject its outer layers in a sequence of spherical shells, consider the internal structure of such a star as shown in Figure 11-21. As the helium in the helium-fusing shell is used up, the pressure that holds up the dormant hydrogen-fusing shell decreases. Hence, the dormant hydrogen shell contracts and heats up, and hydrogen fusion begins anew. This revitalized hydrogen fusion creates helium, which rains downward onto the temporarily dormant helium-fusing shell. As the helium shell gains mass, it shrinks and heats up. When the temperature of the helium shell reaches a certain critical value, it reignites. The released energy pushes the hydrogen-fusing shell outward, making it cool off, so that hydrogen fusion ceases and this shell again becomes dormant. The process then starts over again.
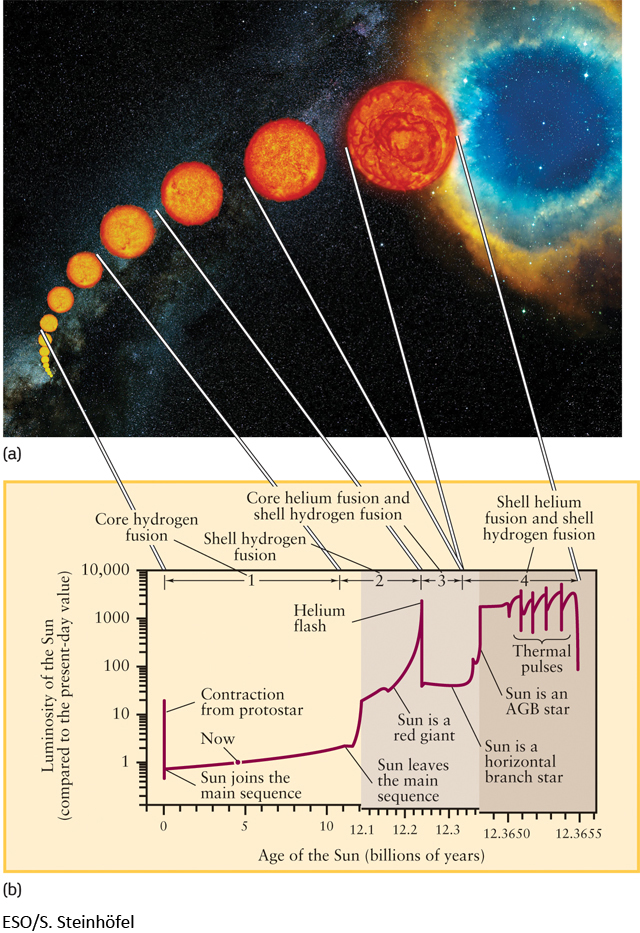
When this momentary reignition of the helium shell occurs, the luminosity of an AGB star increases substantially in a relatively short-lived burst called a thermal pulse. Figure 11-24, which is based on a theoretical calculation of the evolution of a 1-M⊙ star, shows that thermal pulses begin when the star is about 12.365 billion years old. The calculations predict that thermal pulses occur at ever-shorter intervals of about 100,000 years.
During these thermal pulses, the dying star’s outer layers can separate completely from its carbon-oxygen core. As the ejected material expands into space, dust grains condense out of the cooling gases. Radiation pressure from the star’s hot, burned-out core acts on the specks of dust, propelling them further outward, and the star sheds its outer layers altogether. In this way an aging 1-M⊙ star loses as much as 40% of its mass. More massive stars eject even greater fractions of their original masses.
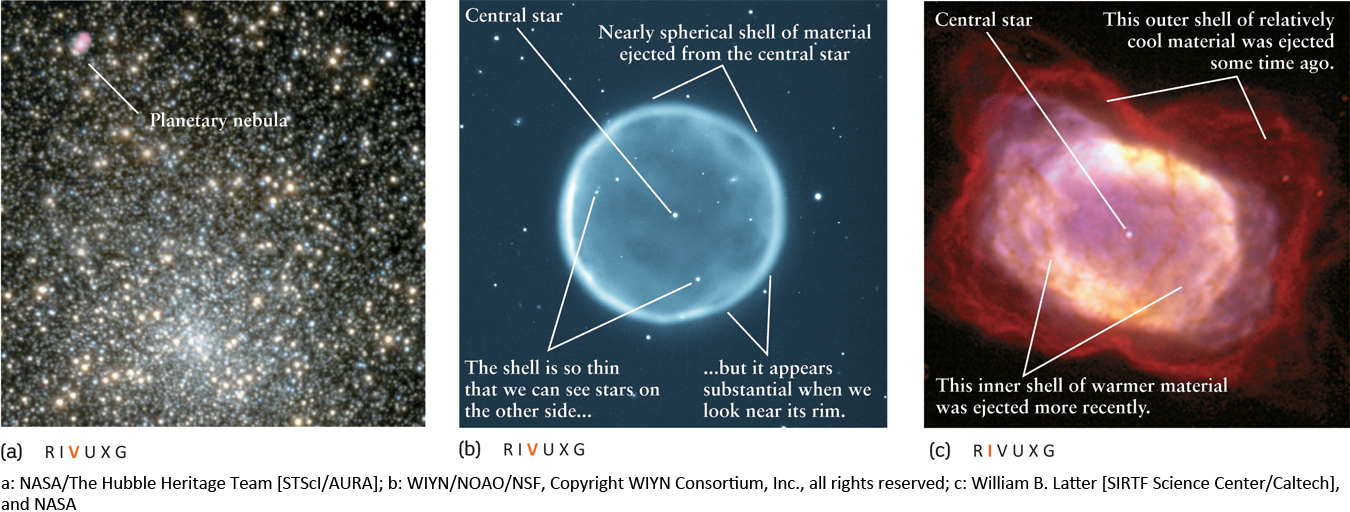
As a dying star ejects its outer layers, the star’s hot core becomes exposed. With a surface temperature of about 100,000 K, this exposed core emits ultraviolet radiation intense enough to ionize and excite the expanding shell of ejected gases. These gases therefore glow and emit visible light through the process of fluorescence, producing planetary nebulae like those shown in Figure 11-25.
CAUTION
Despite their name, planetary nebulae have nothing to do with planets. This misleading term was introduced in the nineteenth century because these glowing objects looked like distant Jovian planets when viewed through the small telescopes then available. The difference between planets and planetary nebulae became obvious with the advent of spectroscopy: Planets have absorption line spectra, but the excited gases of planetary nebulae have emission line spectra.
Question
ConceptCheck 11-17: What is the chemical composition of the remaining stellar core after the planetary nebula forms?
The Properties of Planetary Nebulae
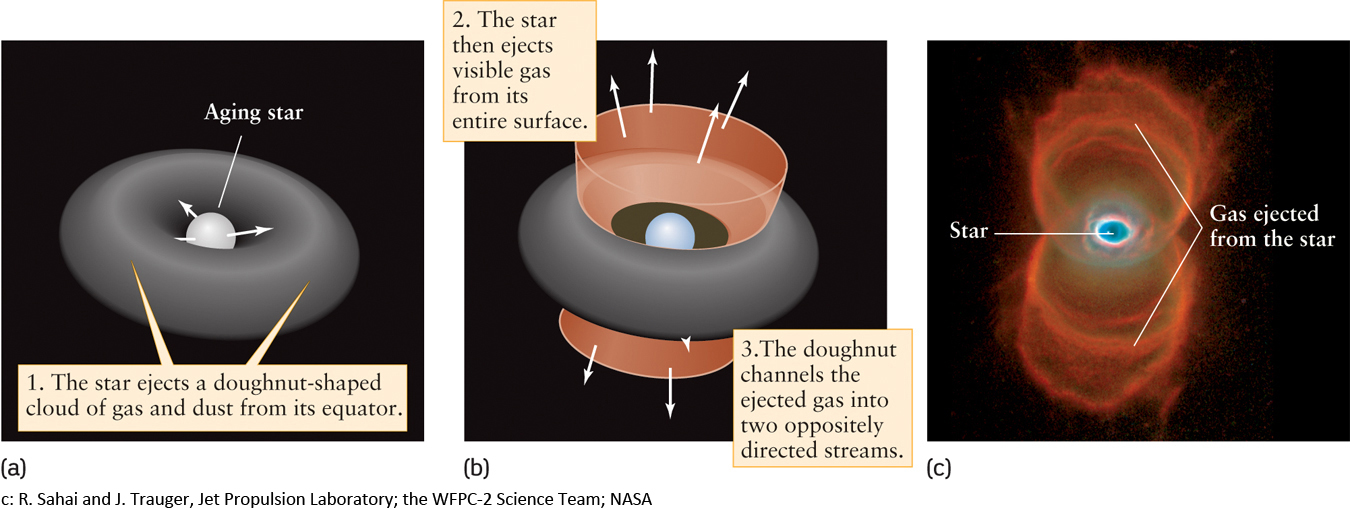
Planetary nebulae are quite common. Astronomers estimate that there are 20,000 to 50,000 planetary nebulae in our Galaxy alone. Many planetary nebulae, such as those in Figure 11-23, are more or less spherical in shape. This is a result of the symmetrical way in which the gases were ejected. But if the rate of expansion is not the same in all directions, the resulting nebula takes on an hourglass or dumbbell appearance (Figure 11-26).
271
Spectroscopic observations of planetary nebulae show emission lines of ionized hydrogen, oxygen, and nitrogen. From the Doppler shifts of these lines, astronomers have concluded that the expanding shell of gas moves outward from a dying star at speeds from about 20,000 mi/h to mi/h (10 km/s to 30 km/s). For a shell expanding at such speeds to have attained the typical diameter of a planetary nebula, about 1 light-year, it must have begun expanding about 10,000 years ago. Thus, by astronomical standards, the planetary nebulae we see today were created only very recently.
We do not observe planetary nebulae that are more than about 50,000 years old. After this length of time, the shell has spread out so far from the cooling central star that its gases cease to glow and simply fade from view. The nebula’s gases then mix with the surrounding interstellar medium.
Astronomers estimate that all the planetary nebulae in the Galaxy return a total of about 5 M⊙ to the interstellar medium each year. This amounts to 15% of all the matter expelled by all the various sorts of stars in the Galaxy each year. Because this contribution is so significant, and because the ejected material includes heavier elements (metals) manufactured within a nebula’s central star, planetary nebulae play an important role in the chemical evolution of the Galaxy as a whole.
Question
ConceptCheck 11-18: For approximately how many years will an isolated planetary nebula continue to expand?
Question
CalculationCheck 11-1: If a planetary nebula is expanding at 20,000 mi/h, how long would it take to become the size of our solar system if Pluto is about 3 billion miles from our Sun?
272
Formation of a White Dwarf
We have seen that after a moderately low-mass star (from about 0.4 solar masses to about 4 solar masses) consumes all the hydrogen in its core, it is able to ignite thermonuclear reactions that convert helium to carbon and oxygen. Given sufficiently high temperature and pressure, carbon and oxygen can also undergo fusion reactions that release energy. But for such a moderately low-mass star, the core temperature and pressure never reach the extremely high values needed for these reactions to take place. Instead, as we have seen, the process of mass ejection just strips away the star’s outer layers and leaves behind the hot carbon-oxygen core. With no thermonuclear reactions taking place, the core simply cools down like a dying ember. Such a burnt-out relic of a star’s former glory is called a white dwarf. Such white dwarfs prove to have exotic physical properties that are wholly unlike any object found on Earth.
Our Sun will eventually end its life as a white dwarf.
CAUTION
Unfortunately, the word dwarf is used in astronomy for several very different kinds of small objects. Here is a review of the three kinds that we have encountered so far in this book. A white dwarf is the relic that remains at the very end of the evolution of a star of initial mass between about 0.4 M⊙ and 4 M⊙. Thermonuclear reactions are no longer taking place in its interior; it emits light simply because it is still hot. A red dwarf is a cool main-sequence star with a mass between about 0.08 M⊙ and 0.4 M⊙. The energy emitted by a red dwarf in the form of light comes from its core, where fusion reactions convert hydrogen into helium. Finally, a brown dwarf is an object like a main-sequence star but with a mass less than about 0.08 M⊙. Because its mass is so small, its internal pressure and temperature are too low to sustain thermonuclear reactions. Instead, a brown dwarf emits light because it is slowly contracting, a process that releases energy. White dwarfs are comparable in size to Earth; by contrast, brown dwarfs are larger than the planet Jupiter, and red dwarfs are even larger.
Question
ConceptCheck 11-19: From largest to smallest, what is the sequence of sizes of a white dwarf, a red dwarf, and a brown dwarf?
Properties of White Dwarfs
You might think that without thermonuclear reactions to provide internal heat and pressure, a white dwarf should keep on shrinking under the influence of its own gravity as it cools. Actually, however, a cooling white dwarf maintains its size because the burnt-out stellar core is so dense that most of its electrons are so tightly packed they are classified as being degenerate. Thus, degenerate-electron pressure supports the star against further collapse. This pressure does not depend on temperature, so it continues to hold up the star even as the white dwarf cools and its temperature drops.
Tiny white dwarfs are all that remain from an evaporating planetary nebula.
Many white dwarfs are found in our local solar neighborhood, but all are too faint to be seen with the naked eye. One of the first white dwarfs to be discovered is a companion to Sirius, the brightest star in the night sky. This companion, designated Sirius B (Figure 11-27), was first glimpsed in 1862 by the American astronomer Alvan Clark. Recent Hubble Space Telescope observations at ultraviolet wavelengths, where hot white dwarfs emit most of their light, show that the surface temperature of Sirius B is 25,200 K.
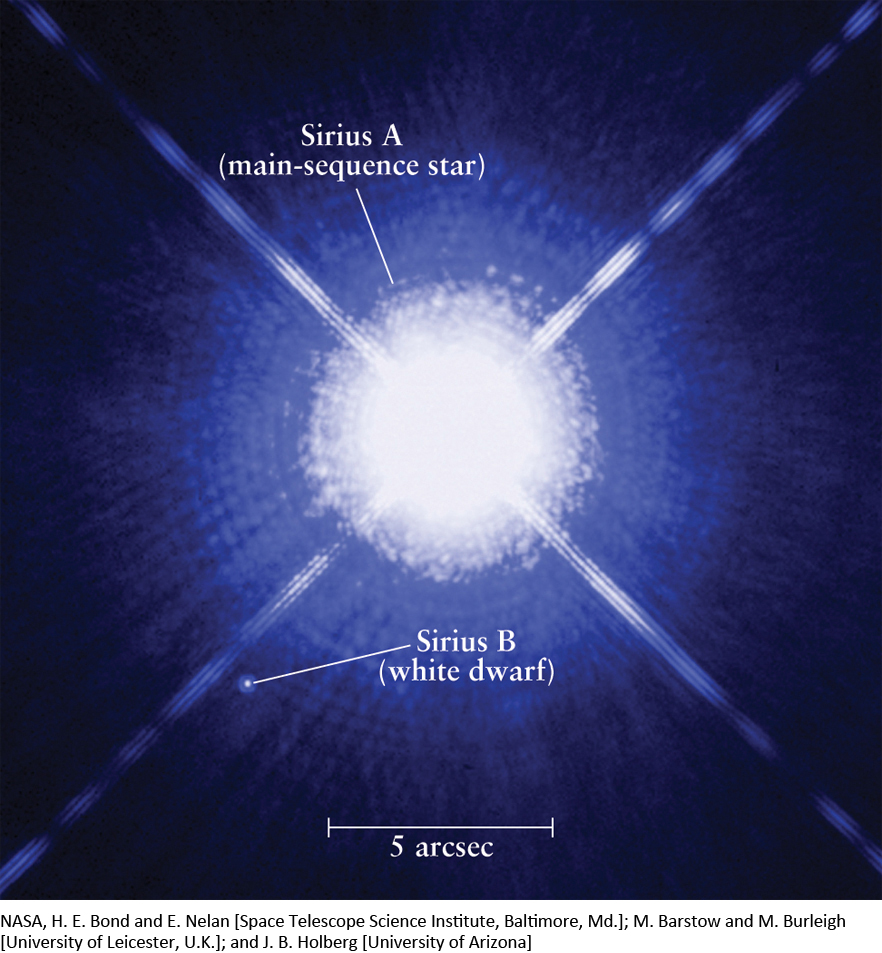
Observations of white dwarfs in binary systems like Sirius allow astronomers to determine the mass, radius, and density of these stars. Such observations show that the density of the degenerate matter in a white dwarf is typically 109 kg/m3 (a million times denser than water). A teaspoonful of white dwarf matter brought to Earth would weigh nearly 5.5 tons—as much as an elephant!
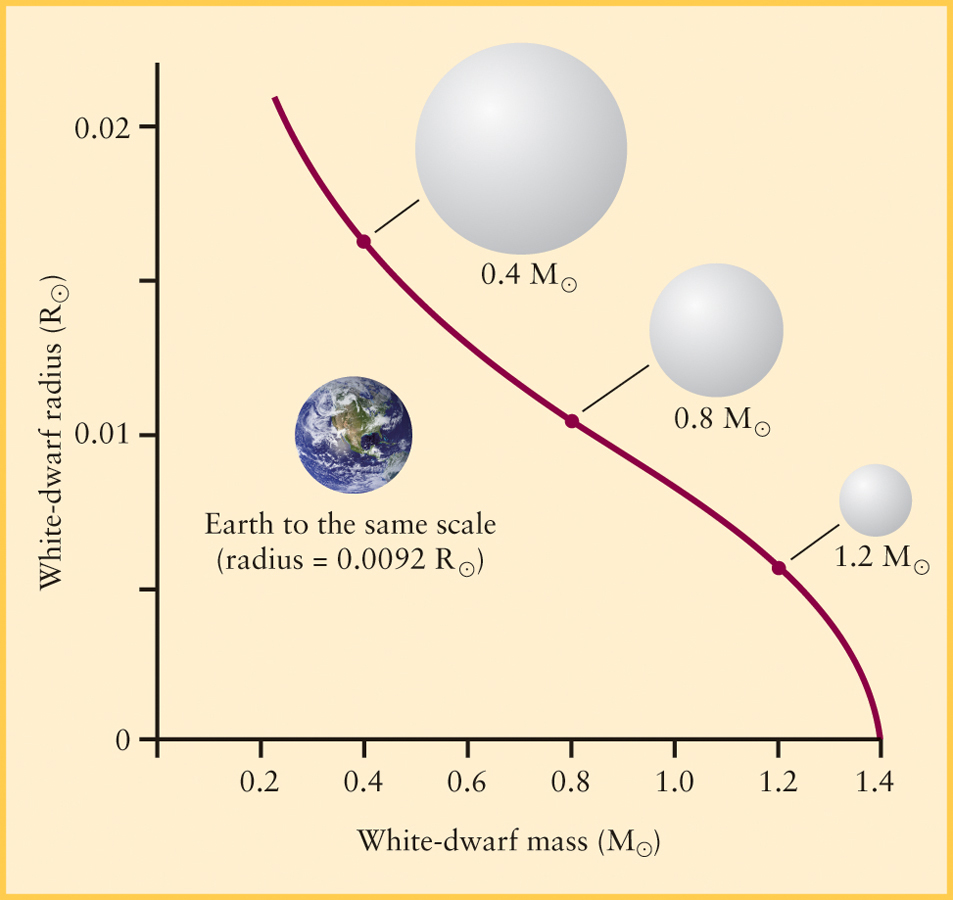
Degenerate matter has a very different relationship between its pressure, density, and temperature than that of ordinary gases. Consequently, white-dwarf stars have an unusual mass-radius relation: The more massive a white-dwarf star, the smaller it is.
Figure 11-28 displays the mass-radius relation for white dwarfs. Note that the more degenerate matter you pile onto a white dwarf, the smaller it becomes. However, there is a limit to how much pressure degenerate electrons can produce. As a result, there is an upper limit to the mass that a white dwarf can have. This maximum mass is called the Chandrasekhar limit, after the Indian-American scientist Subrahmanyan Chandrasekhar, who pioneered theoretical studies of white dwarfs in the 1930s. The Chandrasekhar limit is equal to 1.4 M⊙, meaning that all white dwarfs must have masses less than 1.4 M⊙.
The material inside a white dwarf consists mostly of ionized carbon and oxygen atoms floating in a sea of degenerate electrons. As the dead star cools, the carbon and oxygen ions slow down, and electric forces between the ions begin to prevail over the random thermal motions. About 5 × 10⁹ years after the star first becomes a white dwarf, when its luminosity has dropped to about 10−4 L⊙ and its surface temperature is a mere 4000 K, the ions no longer move freely. Instead, they arrange themselves in orderly rows, like an immense crystal lattice. From this time on, you could say that the star is “solid.” The degenerate electrons move around freely in this crystal material, just as electrons move freely through an electrically conducting metal like copper or silver. A diamond is also crystallized carbon, so a cool carbon-oxygen white dwarf can resemble an immense spherical diamond!
273
Question
ConceptCheck 11-20: How does the size of a white dwarf change as it cools?
From Red Giant to Planetary Nebula to White Dwarf
Figure 11-29 shows the evolutionary tracks followed by three burned-out stellar cores as they pass through the planetary nebula stage and become white dwarfs. When these three stars were red giants, they had masses of 0.8 M⊙, 1.5 M⊙, and 3.0 M⊙. Mass ejection strips these dying stars of up to 60% of their matter. During their final spasms, the luminosity and surface temperature of these stars change quite rapidly. The points representing these stars on an H-R diagram race along their evolutionary tracks, sometimes executing loops corresponding to thermal pulses (shown as Track B and Track C in Figure 11-29). Finally, as the ejected nebulae fade and the stellar cores cool, the evolutionary tracks of these dying stars take a sharp turn toward the white-dwarf region of the H-R diagram. As the table accompanying Figure 11-29 shows, the final white dwarf has only a fraction of the mass of the giant star from which it evolved.
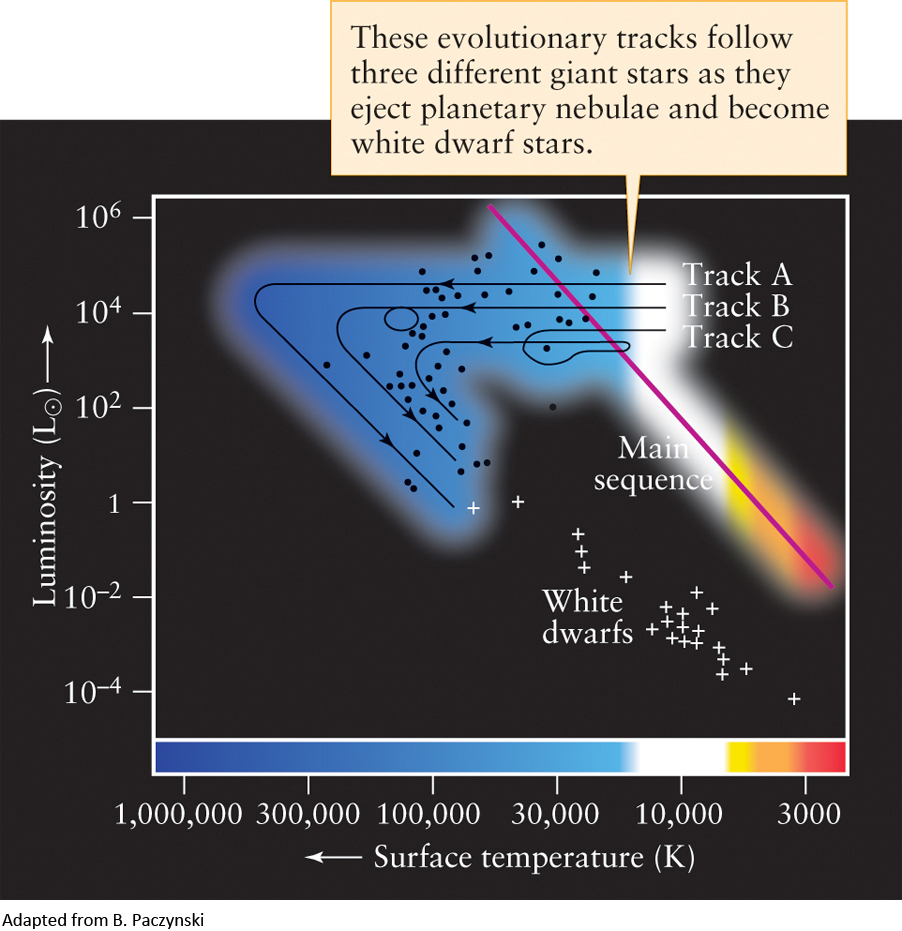
| Mass (M⊙) | |||
|---|---|---|---|
| Evolutionary track | Giant star | Ejected nebula | White dwarf |
| A | 3.0 | 1.8 | 1.2 |
| B | 1.5 | 0.7 | 0.8 |
| C | 0.8 | 0.2 | 0.6 |
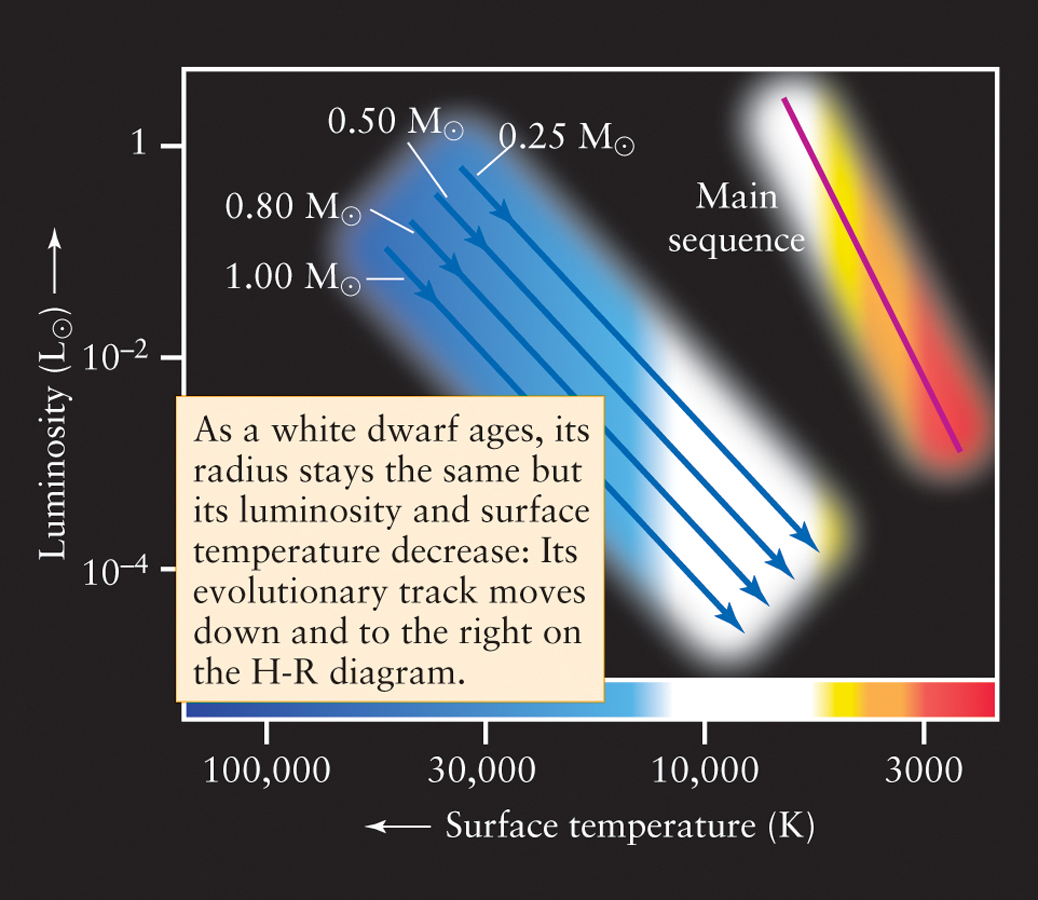
Although a white dwarf maintains the same size as it cools, its luminosity and surface temperature both decrease with time. Consequently, the evolutionary tracks of aging white dwarfs point toward the lower right corner of the H-R diagram. You can see this in Figure 11-29; Figure 11-30 shows it in more detail. The energy that the white dwarf radiates into space comes only from the star’s internal heat, which is a relic from the white dwarf’s past existence as a stellar core. Over billions of years, white dwarfs grow dimmer and dimmer as their surface temperatures drop toward absolute zero.
274
COSMIC CONNECTIONS: The Sun: The Next 8 Billion Years
The Sun is presently less than halfway through its lifetime as a main-sequence star. The H-R diagram and cross-sections on this page summarize the dramatic changes that will take place when the Sun’s main-sequence lifetime comes to an end.
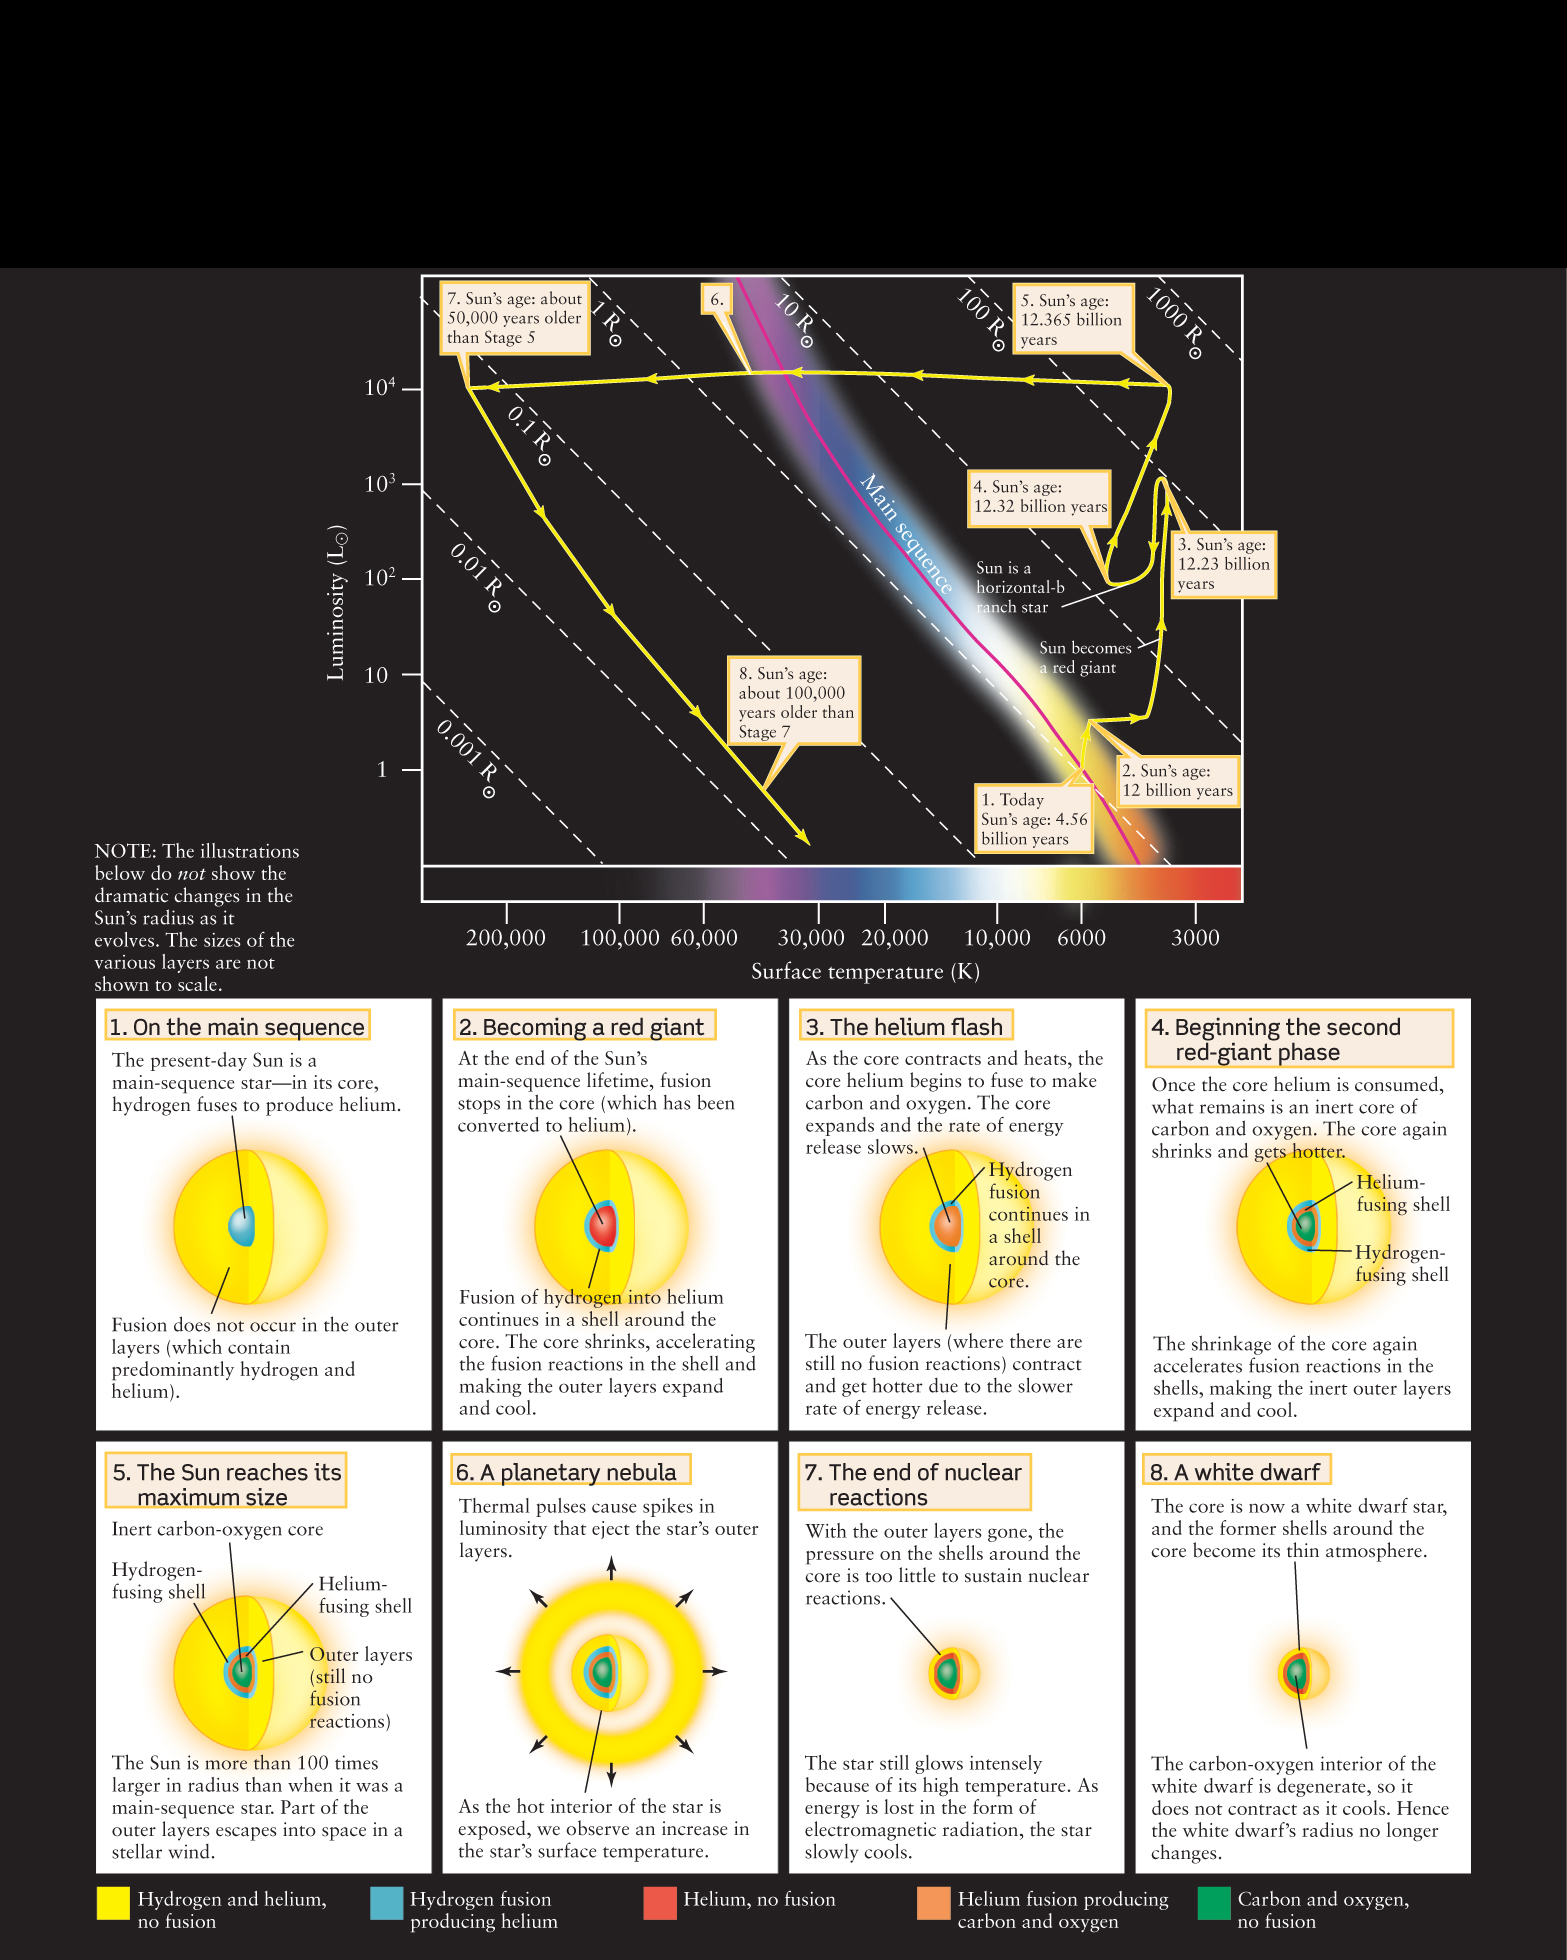
275
After ejecting much of its mass into space, our own Sun will eventually evolve into a white-dwarf star about the size of Earth and with perhaps one-tenth of its present luminosity. It will become even dimmer as it cools. After 5 billion years as a white dwarf, the Sun will radiate with no more than one ten-thousandth of its present brilliance. With the passage of eons, our Sun will simply fade into obscurity. Cosmic Connections: The Sun: The Next 8 Billion Years summarizes the full evolutionary cycle of a 1-M⊙ star like the Sun, from its birth to becoming a main-sequence star to its demise as a white dwarf.
This process describes the evolutionary process of the vast majority of stars in our Galaxy. Yet, the most dramatic and dynamic changes happen in the rarest of the largest aging stars, which we address in Chapter 12.
Question
ConceptCheck 11-21: As the red giant moves through the planetary nebula stage to the white-dwarf star stage, in which directions on the H-R diagram are the star’s graphed positions moving?
276