Chapter 1. Chapter 1: Rainy Days and Mondays
Introduction
Graphic Content Activities

Use the data presented in the graph to answer each question in this exercise.
Question
oNYB2rZddfJ4R6Z3FBweBTu0e+SQv22kbqQV7/2r2A/I+BUNFITwTAbDLvUxro/g7KGhB1b+xIBSqdGpm/4Z98b42z+87ECvlQnqWuDeC69eejCmC5acQNh4P7/MAZGYeUr72TV0WAbNzsbTSbes7Jsv5vQYO0BuQE3o8CyMjXo=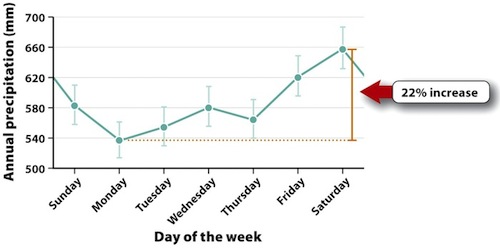
Right! The value on the y-axis depends upon the value plotted on the x-axis.
No. The value plotted on the x-axis is the independent variable. Try again.
Question 1.1
rL0co1em41X4wvI0Ek6AqGOx8vQNNmc+Tiwzw06J52ERgsSWPE2s0qu3sqXah+aWrEhN+/Ue8W/xGFVcewr4xYPkGnHqBh0hEV6NnjCkyi/j22BDsQaz/8DCQPprfeZHFOPoGDuy3nVObbu3pxfuaUxlFTgByq+BLAKW8ZEzZfmSnPCZIPOaDPI14HIqjMfRb8EGawjo+RJf54sOqw+d0Sg8pN7mblL63Z8EPF8UgMj8y/NB8ne3gTw8klFELW/eiLjUtQLIU/yhZ6D2Hq5WiD04UqOiXUvtfqtIi7vjFW2GF5UZidXR4Tw6i0zLnMF1yJidu5knb1mSLxlVMr+bwP5LGVxHfe05KCAD6G/Cwh9AFH2swrw9zfPiPMflBKuEWL4aIx8O2ygpq9AxUQyTnBuyenE=
3
Right! There was an average of 660 mm of rain on Saturday and 580 mm of rain on Sunday, for a total of 1240 mm. Good job!
Incorrect.
Question
NXmezNOOVGxOOPYUaOlQhRCrPskVzSQ4Re5YGgvgAYe4YKtWB0lkWbTAg+2g5VAhsYaY2FBGZlEJB7EEbGaBOk8QmlWyMP/KY2ATi5ZA3Qlwl3pREm/2WlroFyZYVCQ8w5EA6MmnQ0hqCCmtdOjDF0qrjZIjJEspS2lnsA4KIIhCR/1E5316Yqo3EuWIJPKDOL63HPO7HK9gMr3aXZBuSto+EkEZ4esieCakN2iwnEvdlnvmBiAZPdXdcPPXHSI4ZiaTT6/FPjAIQimLKB7Cc6mw7/dKrAxYlcVKehG9SBdDHTlFymsl/W43jMDGo3OJyQKZwnnPnFShONXJrp/8C+kAStQCw7k2ajzMppdw95ImZdEyfmSE1pTvv6UJFcuwcE5HneI3UyptzbI/ZES6pvYQP45c9MZDrY6/9lvWrnD5X+OrnHHruvlGSuSW33zMCDgTkqx0VsUqsieVVLKpVzbNOw4ZAKWMyx3uc0kixMEoDEAHrZpOvRoLLxOGBcgtv/25x/JuVzB44yETlQhPZW+qVqoVvm77kZcPnjL3l+BsrfMkb9mHc8fgAQxHplkhDc3JWrPbvk3Jn8Wg2FtnwfILWCu57RU7vEf/wIgDirAoL1VBHSyG1ZDqZlWDHj/YguQaYP9WDIefPw5yPXMHyw8NqfQYF4TFJIe1NnnWJFMWWkPkYbgPJsDz/am9Gij7kt/rB/5k6zaB9dSZX92uc1p5Nz5nqYYiR0elpsiyRyOfIXx72eZAjFRWKzRm51hDYh2yA2jeqwa1/rml2q5MrqJJ6aZe8PZSkpKFumzFzL3o9Ve3by8IK+eveeg8daSs7VfBtAj2F0bTHcRLRVReZt6CYaacUA+xRI+Io/6iCHm0WIhxB/TMP7MuZCExw3c4NM3mmDN9eVpJkC83WudQdwaewiY=
3
Yes. From the graph, we can determine average annual rainfall on Saturday, and that range is between ~630-685 mm.
Incorrect.
Question
vLNt0gXemg5wrugrcXlJA/IEpEHOF0L/MeqzA0ieyn6EV5wqUA3kugBMOBoP8/oipqCWzPhDcJaeBlM/60rH53hHqDT4x1fv2fXY2sXHtAFo7gbAb/Xxw+wCkvKBDtHcTocsa8lei8F27l5S5qSxAty8NTs=
3
This line represents the range of rainfall on Saturday. Good job!
No. Study the graph, and make sure you are selecting the correct day of the week.
Question
PW9er2Nfj8sv0bp+EkBvxndrR720XQF6qrPsuOlBatOdsU0dInMvOAAdH/sVF1MacrCsqSakPslIUOXaruNxULy18U7WFAb8xQCSSKM2EHUVde26TNUjiQ9nqbbGjI43yl3ZoND0SIJzuy9WoAtsXymkr48jhgiHnpaMmh8nExs28KrsmKEkpcdxp1OBCv/5kk8UvgoA5xs=
3
Right! This range line indicates that, based on average annual rainfall totals, there was a 22% increase in precipitation between Monday and Saturday.
No. Study the graph again.
Question
JJzu5dH3Ah35gcqO2gbcjWKlSFxxTuKWY/evzdsidoublabq8YBm9060QghHwbO/sZfz6OBG4xyLtkpukq9zzaC2hXzM/oDRnUsmk+LDcNhCcijAQUMNiFMo7yIXtWSclwPNbnsw+FTeShx8n6Toocvj+1Sn6xu69wDnDrXWi/Q77FqPDsERdlV+vnGgP2qm8oB6ao1UCcSuCEppfHaZGDGyVmNERAlZgIZDbgg3XrMC3fU655S+LBAIo3uIZoa0mjpBH2ccHLumHDmRnG8Ni0G3VN2WDnD+TI3XwlQ0T0hMPvKHwuMrW0QlRWqFYEApqOn4r5Px0FvEePFb+8xOAydXLtiMbpcSBg+NGKYqgfxnLtLJnjTr/3youW0+XeuahZS07dv4s8Vysq8/lj3gNkbOdgVd1Jw5OPM9MKvOJWxh4kkVQUmJ6GgfZXbLCPgypyPSptzIiRxGH7Tr/Azx33/QxO17i6FevcOHnkc2PmLuDCxq+p8oxCuInxRhcC8tf4sO0IUz1iRmUhJJvSDyfO4Tsrzmuft5kQD59qi58qn+a0leLNZGl3TvAMTzygcC83aiqTx22VdNdZqB
3
The difference in rainfall is about 120 millimeters, which is equivalent to 0.12 meters. Great job!
Incorrect.
Question
BxfutarinFllA+ZSA6KTDgAKp78/0HRctnwtmh3iOPhQIUVFncfMUWDbZqlS8tzFCRPUPslUiy8OUlMJJB7reNh2c9cGcCdpJ3CFZ25ky4GdkWrUmcyRDEoBYXdYAEmRZ3LaF8qqJKt6WJmjM/NS8yIJRpUf5arrcfJ8CJNO2Nx2HzRcDy8TD326lGQKp8dWTCDUv+CnUf7x15M7kpfWS7BfgmUjYos3Yf3D7LCOaNlru+RiZnKNMHZiWV4FW95r3coB62LJtVZGC9V4gPghzi7Q+5wz5DfZ2svbD61SI0GfqTXBJtRRukK4eSVXq51X3F6bC9J8xUAOvAdAjnDznFAqGgQhhlKRx3K0pzPlVynJ38m/uXviDnqdo7R+jFv79ZFoqs1qvCg4zih1Bi4nHNk4C9YoMorpvuKWgOi1F4+WYsfHm6yZF+wS6gQ5V9eNu01iICvdy8LKQFI6DC2PlJ/Ut7R0kA/7jEbg5yKNMkne85lK7f7IG/2KL02VGrLPwmitQ8lr5asqsL5mfas3RD2sUvVTNv3Awg1oKF/Wo4fkB6a3Esdp0syw/R/g5e3ihwNXDGsK9w6R2XKKdcSWEfA+Ae1GtCjH4RifWyVhbD64df1vvhG9XnD2JsRKAdEbN3t7cYEjnr/YEVNAUB0XCyajjhUstLi6gsziS4XARhULLOuPl3wZhons6tEGcD3fQ6EBvy3AVyfes0ZySx7UEtT7uCSPn+0OymVeamZ5ZArmNrbx46mSdDmJ43RZrxZ2LNT8cMUSKrc/692UH2uLAotbwTaEcA9esJVIrSVVz/370ah7YJZxJLd0GbL//9aYCK4OzLH/HpihDQ4FFgiDB1LZSBNwN6wK5sXUUx7QBwMl4h6MfvuzPcB0pdvccRbvlY58z7jfkcsEFEYxZMOz5mfcE+ogSVjwBQu6K7YvqFyXeNGd+IcEAc8G+t8B9NmlPxBCHt1LsvVFSRJTkwEcNd6VemDcsZxj/0ETDg==
3
Pie charts also cannot indicate the range of possible values, as this graph does. Good job!
Incorrect.
Question
xOHV2VB8nLgGsWqjlWb+D8Wpx+vifkpWe6Z0ThR+rStNNwzY+r46v4AQVo9+/asRr1gSE564uVti6Y3JmXBmcg2AD9gHmPXGZfKNQLiljZ4d50gYCPGkawVXbgnXfUY4lRPS0kGipQOzE8pWehNLVfgHdYUQmicwtsOFPUGg2XArfpdsxc5bG5Rd8Qx/zkHrDTCziESa5mWCPQWpTulAS6F7lCRMKWQa {"title":"Sunday","description":"No, Sunday is not the best day according to the data.","type":"incorrect","color":"#99ccff","code":"[{\"shape\":\"poly\",\"coords\":\"40,201,82,165,98,183,54,222\"}]"}
3
Correct! Monday historically has the lowest precipitation totals, according to the graph.
Try again.
Incorrect.
Activity results are being submitted...