Think about design.
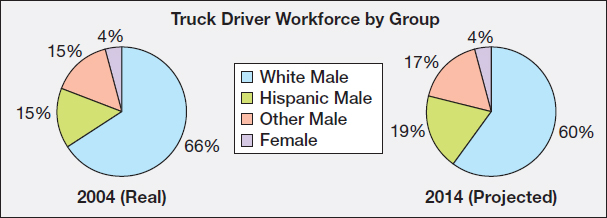
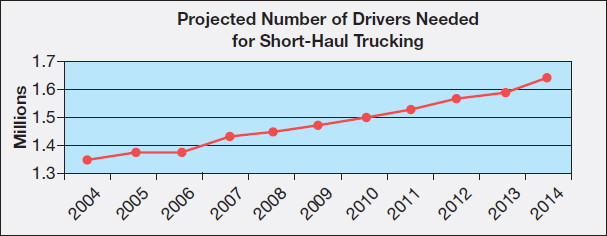
Proposals frequently include graphics because they help demonstrate the seriousness of the problem or show that the proposal will have the desired result. The following graphics are from the project highlighted in the In the Workplace scenario (p. 297). It was designed by the truck driver who proposed a solution to the problem of too few short-haul drivers. The line graph demonstrates the trajectory of the demand for short-haul drivers, and the pie charts show that one demographic group—women—is not projected to increase, despite the demand. If you want to show change over time or indicate percentages of groups affected, for example, consider adding a line, bar graph, or pie chart in your proposal.
Line graph demonstrates the growing seriousness of the problem
Pie charts highlight an opportunity to solve the problem: increasing the number of women drivers