Think about design.
Because causal analyses depend heavily on evidence, especially statistical evidence, to establish the subject and persuade readers to accept the cause(s), writers frequently include graphics—tables and charts. Consider how Sheila McClain uses graphics to establish her subject.
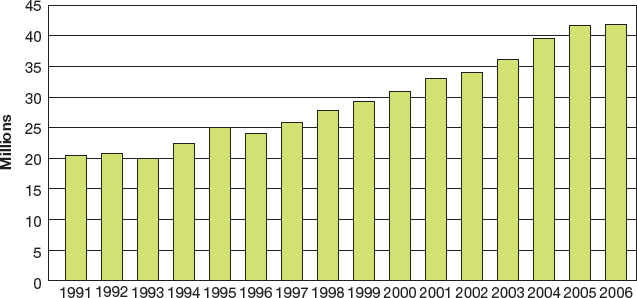
The exercise and fitness industry used to cater to a small, select group of hard-core athletes and bodybuilders. Now, physical fitness has an increasingly broad appeal to people of all ages, and the evidence can be seen everywhere. . . . Fitness club membership, according to the International Health, Racquet and Sportsclub Association (IHRSA), jumped from 20 million in 1991 to over 40 million in 2006 (“U.S. Health Club Membership”; see fig. 1). Although club membership did not change significantly between 2006 and 2009, it leapt another 10 percent to 50.2 million in 2010 (“U.S. Health Club Membership”). As of September 30, 2011, as many as 16 percent of Americans were members of a health club (“IHRSA”).
Uses a bar graph (fig. 1) as evidence of the claim that “physical fitness has an increasingly broad appeal”
Connects text discussion to the graph by including “see fig. 1” in text and “Fig. 1” in caption