Text-Based Visuals
Printed Page 414
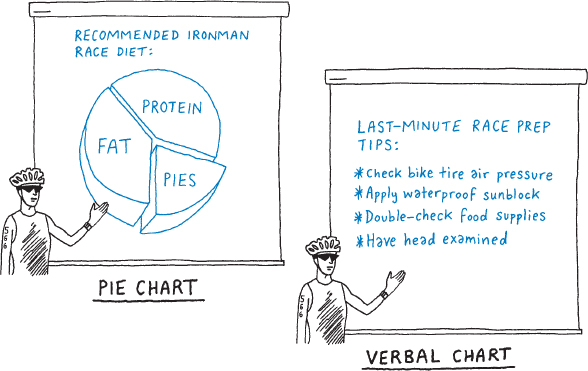
In some cases, presenting text graphically can help your audience organize and understand information. For example, to highlight key ideas or important “takeaways” from your speech, you could use a verbal chart, which arranges words in a certain format, such as bullet points. You might use a simple verbal chart to list tips for last-minute Ironman triathlon race preparation or the parts that make up a motorcycle engine, or to compare the pros and cons of a particular issue in table form.
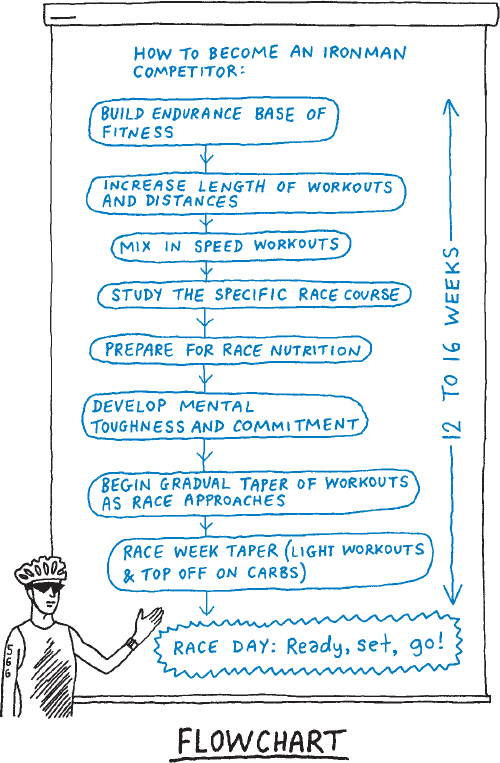
Text and graphics can be combined to convey both information and action. A flowchart is a text-based visual that demonstrates the direction of information, processes, and ideas. You might use a flowchart to show the steps in preparing for the Ironman competition or the process that a bank uses to decide whether to lend money to a mortgage applicant. It is important to use text-based visuals sparingly; you do not want to present your speech outline as a visual aid.