Chapter 1. Finding a value given a proportion

true
Stat Tutor
true
true

Question 1

1:03

Question 1.1

qvrK/SoSHKdbnupYhM8sG47VNKxxjW+STEEGcESlh4X/r1mYQmpJa3tJalrZC7qHEEL+n1LeIJjRZuint+pTBOlwz6fLtBAvlw5zyYbW+hYfyN76moyBf1eSZPVTsWWNnvAi2Tr8KmXlOCIIo3jVr8jjWgEBecbXTzIqrYZtaJn8o8C3SN41I7ypEDXIVzcr9lYfxShGImV2HeekZ8+ao1wjVeGvHY8XXVzrSPgU/ly+jbn1IyBUgRIxZgkHo8vVKnFhAhml8YkrI0G021uaP+1WrQS5HRz3GDj6kvdK0bVSAoI9u7txwirXZqh2ku1h7M1C3sA2NuvyAFlMW/OjTAkP+0Z19uxeVMwlzjCfYtKQLPewTaSSNLmPRqeTNuIqbfujT2wgk64X8+/RS2FNvrZnZZfZ+mXYytzGkg==
Incorrect. Cumulative proportions are found in the center of the Standard Normal table. So to find a cumulative proportion, we look in the center and read the z-score in the margins.
Correct. Cumulative proportions are found in the center of the Standard Normal table. So to find a cumulative proportion, we look in the center and read the z-score in the margins.
Incorrect. Try again.
2

Question 2

2:12

Question 1.2

6Bz5GQG7gsSMGF1UFpJVweGNiXY8c5htNb9jU20uJKam/VHCHFxc1pkfvnsenlALeYLMvIrhw5dVVU46U97Y8KFcwSe6nmsOH+l54e4p9d+E1FzJck9GVB1NHRJ8aFs/CT81d8tniFPoQSjCgimNWRNI0sIvwmNFJIDqulotv08WE1WRQaC/HAG6muhCtxvHCPUKQQpwWGfnM8WZZ2CAjccFL/MQi8Pn/ZXEVAeakNYxxjuzsUpZYScpdQVpoBhb
Incorrect. Before looking up the given proportion inside the table, you must first convert it to a cumulative proportion.
Correct. Before looking up the given proportion inside the table, you must first convert it to a cumulative proportion.
Incorrect. Try again.
2

Questions 3-8

5:04

Question 1.3

jZNgwl4i6G7z67+u58f/ntI4MVUs/PgdRwJjJmMVYq6sQlKx53Veejt6MbMVKWYU5JcrWtlqBQwRZPQ7Euy6zGQFyy/IJE2GR5G86pBlAAnlbFvV3jFbDVJJQPYynesCIPYbRA0BAh3LcGT3KsoayWnemmRfNYWSRNVXJoUt2g3n+8TwsghVYeM1MKtM7rqyIlF147f3avTFfholbxdHvqqA6OwWqDfXThWCjjNqSPaIPZys
Incorrect. The first quartile, Q1, has area of 25% less than it and 75% of the area greater than it.
Correct. The first quartile, Q1, has area of 25% less than it and 75% of the area greater than it.
Incorrect. Try again.
2

Question 1.4

7wGpLZNRyX8GBGR+/U5A5w611VwdehAulCi6Dxjecj04jq8rxZYKQP8iby7OMTAllRgyE/WLVdtPKYVkwrAT5QzDQdu6EPg24le4Tz1eRYb/LBpBCPFmFk4bBnOFbQMBz2k1GN+OgZLfjEW4hziEzx0WQeZFXBwKAricZ/vGKU8q7/BMI0cY5/t4CHiVPJdgiA/LaCvSgv/wKQie
Incorrect. 90% is area on the right. To get cumulative area, we subtract 90% from 100% to get 10% or 0.1000
Correct. 90% is area on the right. To get cumulative area, we subtract 90% from 100% to get 10% or 0.1000
Incorrect. Try again.
2

Question 1.5

wLyDHP4jvR6pAgnvzamnTj/TzDfRtw30xLnOP3jvwaNfePIRADvbVFaOHWH8lMfPwqtwXSQK7mLouPXck941PCm1AE9B+mYJP3MJjSMRcEgzKQzcFepE8f0ka+Kt5IgzR/HLaaSThnLC1nUyq4+MY9e6kBjcaZIZQ2OpjFAL4fq+6XOdU1TPoOGqJVICwfeVus65mg==
Incorrect. 40% is area on the left, so the cumulative area is 40% or 0.4000.
Correct. 40% is area on the left, so the cumulative area is 40% or 0.4000.
Incorrect. Try again.
2

Question 1.6

Y2biIKZg6T4P5k9FjvfxB7J2s4jGt2Wuxo+ciW9nTJ4nrzttAj6L0yIArMPwiN6Wx/T2x74PhpyhcvitoZt3dxuMiGwqzXll3qvGw7saneNZZn/Qgcl5rQMhJfAdSuwNWLumP2KpJ0RQ2Tgj94UAhiRTebfUeZfbzAO1TpyYPkaOJKWpA4agJEpOp0jCx8qZr1Vt6sDP89ltf+cqmwMixKLrVIs=
Incorrect. 100% – 60% = 40%; dividing 40% by 2 to get the area in the lower tail, we get 20% or 0.2000.
Correct. 100% – 60% = 40%; dividing 40% by 2 to get the area in the lower tail, we get 20% or 0.2000.
Incorrect. Try again.
2

Question 1.7

h5q9g5wbOo0d3VfjfRvlrHrENmu99xJi5xk4bq+uyrSybImKZsrmzQpo5b52G03zXipnHafZ0pYe095ON4mP3y/jN/WfINS/LYh7SjRvgHWzOu3X/cN9wetolHOOW9XVdXJJDobyDJJE63hxcYn4BL+C7kEzUeEXReESwCJPUCDM8AA6TmTBGwonzV9Ya+HRg4cT/eef4r6BFUIC74gyj80seMxnqJZ8o+SRlfbRX+3m68xVXph4s9eI5mD2tOiAes6nEQ==
Incorrect. Since cumulative areas are given inside the table, we locate the cumulative area and read the corresponding z-score in the left and top margins.
Correct. Since cumulative areas are given inside the table, we locate the cumulative area and read the corresponding z-score in the left and top margins.
Incorrect. Try again.
2

Question 1.8

xKAydwbklB9yDK9xyO8RHl7du8Kw+3TsOp8YkUolOfTYOBJU7jLNBMy899g7W+XTomdb63BTsG8X5bGxd59/W02N82uOhBMaE/osMquMKhMGTsKWSljsV2eLbhGEv2n1Xc/jEXQeBg2duq2Aqf/390JlhH+pKusP0sr7/Ulw+SUkwJjhXf/BIaPzrvVAExLfqIMXyugzv00rRVE/Hwq4/Dg/dzHKtL0n85eZ+B3o18fBcViHhVZTm69vRjmh445ajIipCt6wl8hErMSuKk6WLLT44264enuEc/bSyBRjXtJrzpExgGl42z2aj/FzaoORbX6FqA==
Incorrect. z-scores are given in the left and top margins of the table.
Correct. z-scores are given in the left and top margins of the table.
Incorrect. Try again.
2

Questions 9-12

6:19

Question 1.9

u64EYUYwvVj8lmT7Qmd7F6w8LOJvDJjWu6SzFP4wbEDCy3FgCyMvJhbHQHXufTx5MJA6S3LyGMxD28EhcY/fNS2rELJKoe5/yEQu9tAi4zCb6N22LZUlPqyae5RIBsBDo/qZVos1nEDwRkbK4IkvCj9XzkGq0Gfd960nJtVD0m2GKU0TESS9OgB6k+GrD2mPShvv9+ArIfR+N3JCsQ5opuI168e+HZjY3eBkqzQItN8S9w32BF/A4A==
Incorrect. This is a correct statement.
Correct. This is a correct statement.
Incorrect. Try again.
2

Question 1.10

HFO/ebr0khJb3LpCWfKMp8ML21q+4xnhnuF61BtZCkmbL99QDq75iYFnOlk6vye0JZEKNG9+TeI2oSUj1YRlfawmmLbIi1cMbBJOvc7vE7vVF5E/3qCe57KRA3Qbtjr+ocoH+W4nEsVzIumpsk10pzK1SPinEsikZAWQd3/9El9Mmq1uU+6FFLBfKt3gg6cCKWamfGZafcAOCw/glwfRk/96rrIOqu++KCRjqh10ZKG4C2Ofewyv1CrcozyPGeSeta2HBNW0CueARWbmI47scg==
Incorrect. This is a correct statement.
Correct. This is a correct statement.
Incorrect. Try again.
2

Question 1.11

Data Table Image
Ya/hJDddzC7MQLJ4yVa1+psMoodXSV7sa9bSpTyYkEZsZu4R/cs7MWP29LXd2GpE91SuKVxh8st2Yt0NTBoMG/0Rm645f5lRA7SbDSc2s9fZUgkM1jP0Dej2st0AVvKarhteRNGj9HEFG1cYPrEEYCjyOsOB4cm/ismocrcupC4ocgFd5P6ThoYfDwx1z/+YlgCiRTsaQrA=
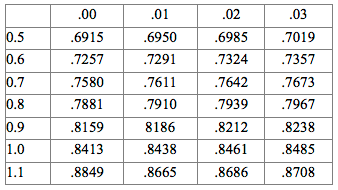
Incorrect. First of all 0.73 is a cumulative area. The closest area to 0.7300 in the table is 0.7291. This corresponds to z = 0.61.
Correct. First of all 0.73 is a cumulative area. The closest area to 0.7300 in the table is 0.7291. This corresponds to z = 0.61.
Incorrect. Try again.
2

Question 1.12

Data Table Image
MCvROwv8lrg2soswynqBVoMI+5yfwjmkiFyJwvdResWMQ7HtJYPlCjFLZI64fDc9nBP3l9jz0YA5SHqlYwqv/IjsxbdVhXbA3smP/y5tXsjj9nEUmDZ34XWJQGzJhfrCca5RbbzYoGE6ei57AYbk5NaOa6+tDpA7uMdNPuD04gS0wDW5nH667qEYwvjIOq7J
First of all 28% is area on the right. To find the cumulative area, subtract 28% from 100% to get 72%. Looking up 0.7200, we find .7257 as the closest. This corresponds to z = 0.60.
Correct. First of all 28% is area on the right. To find the cumulative area, subtract 28% from 100% to get 72%. Looking up 0.7200, we find .7257 as the closest. This corresponds to z = 0.60.
Incorrect. Try again.
2

Questions 13-16

12:10

Question 1.13

Normal Distribution Image
E6EaACQUQzlCEx3RzsVH/79VrUOcd96BJ9+9wxdkOB6QLeamyuN/6eOiXV0Q1Y/xOxqsgI/9O5SGbeJKQXfNh70MYZrvZw3gAcnYbCKkdZjnXGaM6ryKJZS37yJnAFUm78bw6CSnNxw5j45Ai7Ar8WyrM0b0+CJ1HiooKX1QkCg539tp13V8t1ZLQXSSIegFL8m56kLUN4LcRBXCNq4ed1gy3O6vwyk8RwqdKFcE76diPj27C2m1zXsZYmPd2osPpkDSaSBzEzzxLrW7
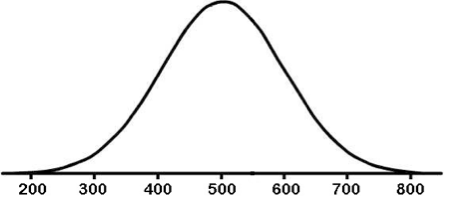
Incorrect. 68% of the Math SAT scores are between 400 and 600. 100% minus 68% equals 32%. So the area below 400 plus the area above 600 equals 32%. Half of that is the area above 600. So, 16% of the scores are above 600.
Correct. 68% of the Math SAT scores are between 400 and 600. 100% minus 68% equals 32%. So the area below 400 plus the area above 600 equals 32%. Half of that is the area above 600. So, 16% of the scores are above 600.
Incorrect. Try again.
2
Question 1.14

Normal Distribution Image
hSZ1aA2FEQSeFJ5hXjxIjv58IiK5gpYJEkMKTFGvnx2LYz3nyM4k+dNQXaEPt7ayw4ueurS8z3svEXdSiq3aB8YSI4ODBlGmCvlIxhu5zLmTR3Mfuwe6lF769e3Fq8yNQ9O7D81fJGe6m2HjzpCKH+t4i6SrRaSIYAiFMXQ7JN4dlY/vzXQENr/EIHCj2799LW3jshLsEB0BHqKCGsT+Mxk+hIL7i3PuieT4huWzbP5qzsIpdVBeTGVBvzc8SLMFlCA8OZKEZlBhHtAUNOlNzQa/g4eihhCo
Incorrect. 50% of the area is less than 500. Between 500 and 600 is half of 68% or 34% of the area. 50% plus 34% = 84%. So, 84% of the scores are less than 600.
Correct. 50% of the area is less than 500. Between 500 and 600 is half of 68% or 34% of the area. 50% plus 34% = 84%. So, 84% of the scores are less than 600.
Incorrect. Try again.
2

Question 1.15

Normal Distribution Image
Data Table Image
tgxiWbdxRwM2Pvkg0IHoo4E1tLsPjZMfi1+VfUzmDOqVC8b8n4H1AMnzPHvBnML0L1mTH4pO+uyYvENhJNVN/mCDfW3gcny1v75HqPO8xbqULNZdHnYqaaSLuD1DXO1TpkSUVGp+tueJO/Sj8pnyftF/dJF+G7M8HJBA+G7ocLisKB/yJzGTOddPn0BCILrwrXfyE57KhYg3Ywq6/IyIgCa+khgP38hpL/jcnLVWrlh6ejNpd8R90R9IA4ZSsDUOlYhxzxIZRoLBwmmHi7sh2jfY/BNnjdeSfp8D4vg9ZocwVFTauKJVZg==
Incorrect. Since 79.1% of the scores are below the score of interest, we know that .7910 is a cumulative area. Looking up .7910 inside the table gives us a z-score of 0.81. We find x = µ + zσ = 500 +.81(100) = 581.
Correct. Since 79.1% of the scores are below the score of interest, we know that .7910 is a cumulative area. Looking up .7910 inside the table gives us a z-score of 0.81. We find x = µ + zσ = 500 +.81(100) = 581.
Incorrect. Try again.
2

Question 1.16

Normal Distribution Image
Data Table Image
jZxFBl4v8otRxIGNOSJLovchmspcQ9KUCB504t6lqdj1rxwnV5K7FoFyk5jZtMXwOG5+z8Bm7z6CiKkariwzkPC7C8ipTrE4l694D7Ww934K2ibJGzKupm8n4DjDDik98nL4h9pMnBBVM9xSD/mzUIz0M2imDDYslxUD6G75PNxnKFgWU1xMtzPh0LSg6Zdo7dBB8V0kGLkvSO1Uorl2+gAiZleYpu0hClyvjAy3BE2HiF6ps+2QMeN/0edE4NW1IMUJgeHCJjv1mcMpN7luaSY2G/N/ZuSLybqBRDBIOGnFgyaqbvIVnlFEcAkyn78SFa2w0e8h14eRQ9VQIsiW8i3UdAqblQPK8EwrwuJKgOQydI+Yi8bLEb7YT6yG1897TwSBdrmzGEwAtnn+Xtm7FAII9tM=
Incorrect. Since 24.2% of the scores are above the score of interest, we know that .2420 the area on the right and is not a cumulative area. To get the cumulative area, we subtract .2420 from 1 to get 0.7580. Looking up .7580 inside the table gives us a z-score of 0.70. We find x = µ + zσ = 500 +.70(100) = 570.
Correct. Since 24.2% of the scores are above the score of interest, we know that .2420 the area on the right and is not a cumulative area. To get the cumulative area, we subtract .2420 from 1 to get 0.7580. Looking up .7580 inside the table gives us a z-score of 0.70. We find x = µ + zσ = 500 +.70(100) = 570.
Incorrect. Try again.
2