Chapter 1. Tutorial 1.3: Creating and interpreting stemplots and histograms
1.1 Problem Statement
The data set below shows the $a height in inches of each of the players on the Chicago Bulls roster for the 2012-2013 season.
A
[ [200, $a, 400, 300] ]
["United Airlines and even<br/> longer will it wrap?", "Two", "Three", "Four"]
B
[ [200, $a, 400, 300] ]
["United Airlines and even<br/> longer will it wrap?", "Two", "Three", "Four"]
B
[ [200, $a, 400, 300] ]
["United Airlines and even<br/> longer will it wrap?", "Two", "Three", "Four"]
B
[ [200, $a, 400, 300] ]
["United Airlines and even<br/> longer will it wrap?", "Two", "Three", "Four"]
Question 1.1
i2AHWqlr3li0pqqhlb+2FRXrMloQJ2UcLVkpAV+T8chuC+vjl/obhkgPjT9kGCan| name | age |
|---|---|
| Adam | 31 |
| Bill | 23 |
| Jim | 44 |
Use stemplots and histograms to examine the distribution of the players' heights.
1.2 Step 1
questions
Question 1.2
First we will create a stemplot for the heights. This will require the following four values for the stems: 9O/nC4r5UrWvBzNKo202zwpzCJaC4rXw5HJm3fuYJxYNoX13a5kHOhzTA7okJ9ZaS7ddpceyVUfUGTxuCbIb0HBG/eNT08KuEuk5Tg==.
Question 1.3
In this stemplot, 7|6 represents a height of 2ZhtxViH2ic= inches.
Question 1.4
F/UayIUywSrrslf7VI5Du5afwpo+ryda6QQIbv20qbwXvhX34V0BPDqaMdKgOifywkFh/IC3M3hBUCJK1rh5dUYCaGyxov0cGjiTVBgOPUDfmRqLImTm7df0hIbp8V5WJa3CQyeFCfdoqudiHggNdnXI9y9ych+sAzKHPE1jdGWu0BWV2kE0x+Ok0A7Vvrer4HukM6NNSuQjN2gEqLvKJ9ovPtdE2f+pVwHeE+KH0bAZhkZFuyQ0subW51zR6CoryfP3RnxzyaK8+0LbOfO/8MUzk6WML9uyLaWsoA==Question 1.5
Complete the stemplot correctly by typing in the values on the remaining rows. Notice that no spaces or commas are needed, since each data point is a single digit.
6|vNR2pB+ndg/IYDLqDOFe9+Ck3CQ=
7|455677999
8|B4VRgC7kDSxT7NtOPH4HuJcm7q9WfVffymdiZQ==
9|NvfitAjpWUROvcl99mjhGsZ403o=
Question 1.6
DOqinsMgYpKr9qq+Lx//sKouFh+eYA8bJ4EGI86vT3mPnWAwpyt2bRuS3CnkR7ZMhrbSaTLPXyxJrsT9TJFaCrrm+fe5G57WLUot/a+VosZkZk4RGGYSPF6gu5cKSrVO/lVzMpMpISP/NuPGSr2L11cwjeZ3OdruY21mzeCM1omcYFnp2EA33A==1.3 Step 2
questions
Question 1.7
Next we want to create a stemplot for the heights with split stems, so that there are two rows for each stem. Give the value of the leaf for each of the following heights, and tell in which row the leaf should be placed (first or second row of the 7 stem).
The value 70 would have leaf 1Wh3cvJ2xF4= and would be placed in the 9gvpUFFJ6DoNbnjUmWibGEB+i7M= row of the 7 stem.
The value 74 has leaf h4XZagboIgc= and should be placed in the 9gvpUFFJ6DoNbnjUmWibGEB+i7M= row of the 7 stem.
The value 75 has leaf DYU2tVvtzEQ= and should be placed in the nqed37sbuHt4yoRW1WqnRjcQx/U= row of the 7 stem.
The value 76 has leaf yBhAQ+3VvjM= and should be placed in the nqed37sbuHt4yoRW1WqnRjcQx/U= row of the 7 stem.
The value 78 would have leaf L6bSXEGJIC8= and would be placed in the nqed37sbuHt4yoRW1WqnRjcQx/U= row of the 7 stem.
Question 1.8
Complete the stemplot with split stems correctly by typing in the values on each row:
6|A8O9vJu7f6k/xPs36Q8/fV5W+YwUQAyW
.|vNR2pB+ndg/IYDLqDOFe9+Ck3CQ=
7|SBqsZgbc0pChbrZi1zFePWq26e0=
.|MVLRFNGFkwu5bqI6qYh7HkBB4G5SLpChTGMERw==
8|B4VRgC7kDSxT7NtOPH4HuJcm7q9WfVffymdiZQ==
.|A8O9vJu7f6k/xPs36Q8/fV5W+YwUQAyW
9|A8O9vJu7f6k/xPs36Q8/fV5W+YwUQAyW
.|NvfitAjpWUROvcl99mjhGsZ403o=
Question 1.9
The following features of the data set are more apparent in the stemplot with the split stems than they were in the original stemplot. Select all that apply.
A. The peak of the data set is in the 70s. 3hMJDRP6OS+3EJIb
B. The largest value in the data set is probably an outlier. wg8JNehuALfILP6S
C. Most of the player heights are in the high 70s and low 80s. wg8JNehuALfILP6S
D. The smallest height is 69 inches and the largest is 96. 3hMJDRP6OS+3EJIb
1.4 Step 3
Question 1.10
Now we are interested in constructing a histogram of the height data. The stemplots can be viewed as “rough drafts” of two possible histograms. Fill in the blanks with the appropriate values:
The stemplot with split stems corresponds to a histogram with bin size WOdng0lNJA78gaIF, and the original histogram without split stems corresponds to a histogram with bin size ssgjZoUOlb7eWvQx.
Question 1.11
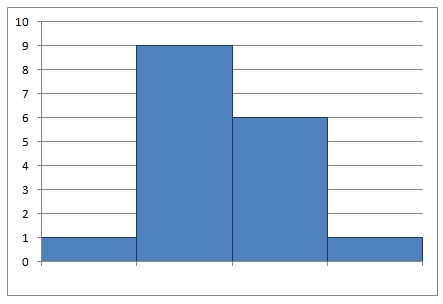
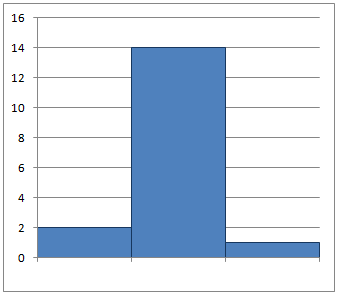
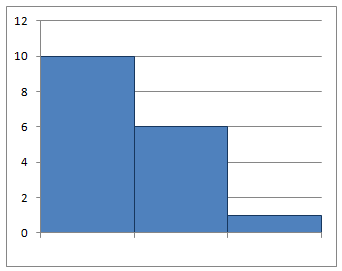
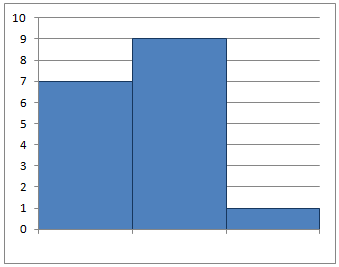
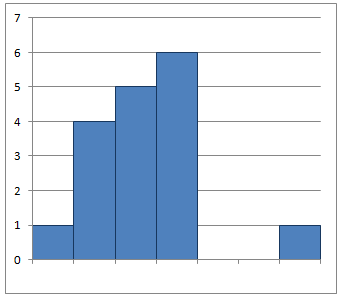
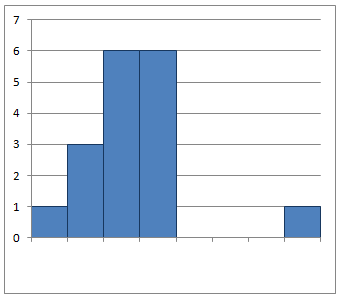
The following histograms were constructed from the height data set. The horizontal axis is not labeled, but the shape of each histogram is related to the bin size and minimum value used to create the chart. Match each histogram with the correct description.
Question 1.12
Question 1.13
Question 1.14
Question 1.15
Question 1.16
Question 1.17
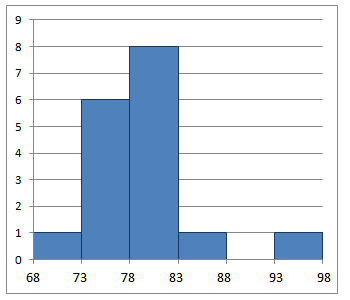
Which of the following statements are consistent with the distribution shown in this histogram? Select all that apply.
A. All values in the data set shown are larger than 68. 3hMJDRP6OS+3EJIb
B. All values in the data set shown are smaller than 98. wg8JNehuALfILP6S
C. The distribution is symmetric. 3hMJDRP6OS+3EJIb
D. The distribution is skewed to the left. 3hMJDRP6OS+3EJIb
E. The distribution is skewed to the right. wg8JNehuALfILP6S
F. The histogram strongly suggests a high outlier. wg8JNehuALfILP6S
G. The histogram strongly suggests a low outlier. 3hMJDRP6OS+3EJIb
H. There is a gap in the histogram. wg8JNehuALfILP6S
I. The distribution shown is bimodal. 3hMJDRP6OS+3EJIb