READING VISUALS CRITICALLY
Visuals appear everywhere — on television and in movies; in magazines, newspapers, textbooks, and presentation slides; on signs, flyers, and billboards; in print and online. They may appear on their own, but often they are combined with text to make a message even more effective. Visuals are used so widely because they can convey information and impressions, sell products and ideas, raise questions, and trigger emotions. Because they are so powerful, make sure you study them as carefully as you read, analyze, and evaluate written text. You should also choose them carefully when you use them in your own essays. (For more about using visuals in your writing, see "Incorporating Visuals into an Essay.")

Consider, for example, the public service advertisement (PSA) from LoveIsRespect.org. What did you notice first? Perhaps you noticed the headline with its shocking statistic: “Dating Abuse Affects 1 in 3 Young People.” Or perhaps you noticed the photographs of hands holding speech bubbles telling viewers what love really is (“the closest thing we have to magic,” “caring enough to ask,” “respect,” “playing fair”). Or maybe the white shape in the bottom-left corner caught your eye, with its message: “Connect NOW!”
Whatever you noticed first, second, or third, when you put the text and images together, you recognized the purpose of the ad: to help young people who may be involved in abusive relationships understand what a loving relationship should be all about and to provide them with help to “break the cycle.” The design, the colors, the headline contrasting with the photos arranged in the shape of a heart below: Together these elements make a dramatic statement about love and self-respect. By combining words and images, this PSA makes the issue of dating abuse much more compelling and engaging than it would have been with written text alone.
| Table 4.2 Analyzing Photographs |
| Guidelines for reading photographs actively and critically |
1. Preview the visual. What is its main subject? What did you notice first, and how did it affect you? |
2. Study the visual as a whole, and then examine its parts. What is its focal point? What details appear in the foreground and the background? (If you are a verbal learner, translating the photo into words may be helpful.) Is it a close-up or a distance shot? (Close-ups may reveal emotions; distance shots provide more context.) |
3. Read the caption and any accompanying text, consider the context, and make connections. What information about time, place, or subject is provided? What does the author want to emphasize? How does the photo relate to the ideas presented in the surrounding text? What happened before or after the photo was taken? Is any other context provided? |
4. Determine the author’s purpose and intended message. Is the purpose to inform, amuse, shock, persuade, or some combination of these or other motives? Is the photo intended to elicit a powerful reaction from viewers or to provide information? |
READING PHOTOGRAPHS ACTIVELY
Use the guidelines in Table 4.2 when reading photographs and any words (a caption, labels, slogans, text) that accompany them. What do you learn when you apply them to the photograph in Figure 4.1?

READING GRAPHICS ACTIVELY
Graphics organize and condense information, making lengthy or complicated data and concepts easier to understand. Writers use many types of graphics; the purpose of each of the common types is summarized in Table 4.3.
| Table 4.3 Graphics and Their Purposes | ||
| Type of Graphic | Purpose | Example |
|
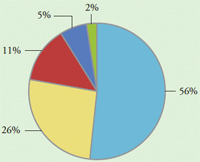
Pie (circle) chart
|
To show the relationships among parts of a whole; to show how given parts of a unit are divided or classified | A chart showing the proportions of different racial and ethnic groups in the U.S. population |
|
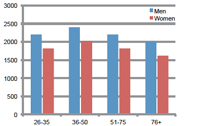
Bar graphs
|
To make comparisons between quantities or amounts | A graph comparing the number of calories needed by men and women leading sedentary lives |
|
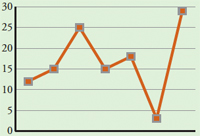
Line graphs
|
To show changes in a variable over time or to compare relationships between two or more variables | A graph showing variations in quiz scores |
|
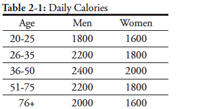
Tables
|
To organize and condense data; to compare and classify information | A table showing how many calories men and women need daily for various age groups with either an active or a sedentary lifestyle |
|
Diagrams and flowcharts
|
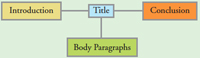
To explain processes or procedures or show how things work | A diagram showing the parts of an essay |
Use the guidelines in Table 4.4 when analyzing graphics and any words (a caption, labels, slogans, text) that accompany them.
| Table 4.4 Analyzing Graphics |
| Guidelines for reading tables and charts actively and critically |
|
|
|
|
|
THINKING CRITICALLY ABOUT PHOTOS AND GRAPHICS
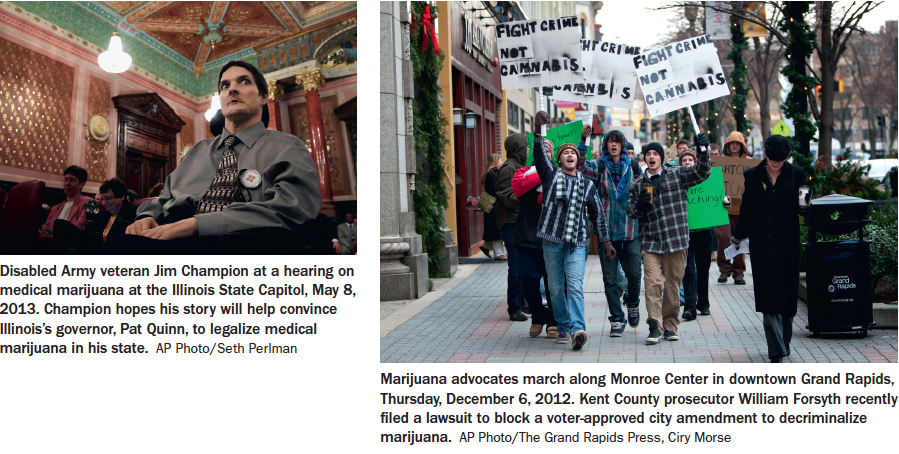
Just as you should critically examine all the words you read, you should also critically examine all visuals that accompany a reading. Photographs and graphics may reflect bias or distort information, either intentionally or unintentionally. For example, an author may choose more or less powerful photographs demonstrating one side of an issue or another. (See Figure 4.3 below.)
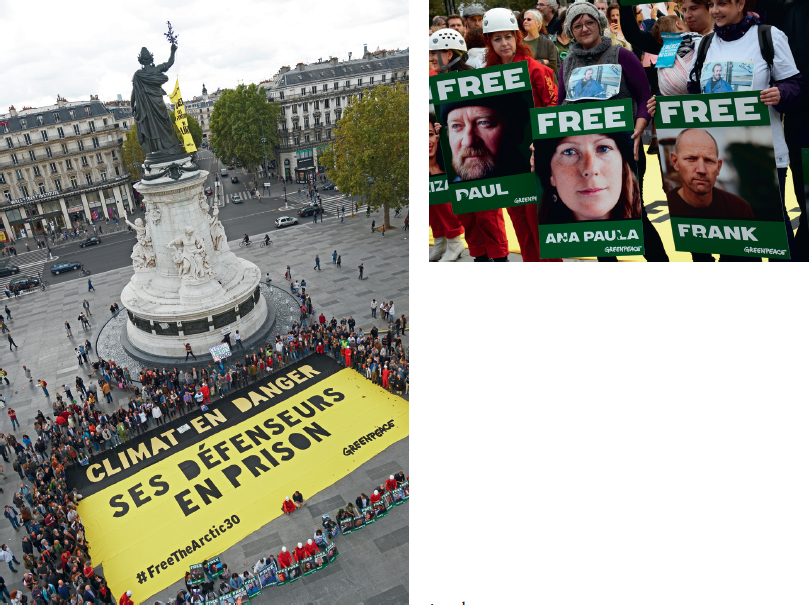
Or an author may crop a photo to distort the viewer’s perception. Compare the photographs in Figure 4.4. These photos show a rally to free thirty Greenpeace activists who were arrested for piracy by Russia. The photo on the left provides a clear sense of the size of the rally, whereas the photo above, taken from a different angle and cropped tight, could mislead some readers into believing the rally was more extensive than it really was. The close-up of the activists’ photos is also likely to make viewers more sympathetic.
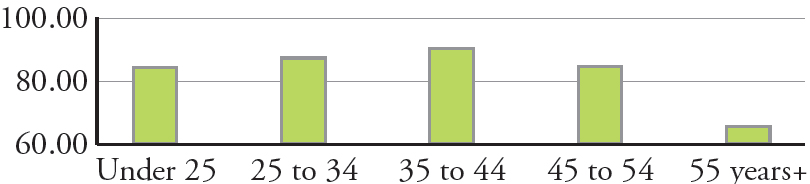
When reading graphics, consider also whether showing the data in a different type of graphic would change the reader’s perception of the information. Compare Figure 4.5 (below), with the figure in Exercise 4.19. The downward-slanting line may suggest a greater difference in usage by age group than the bar graph suggests.
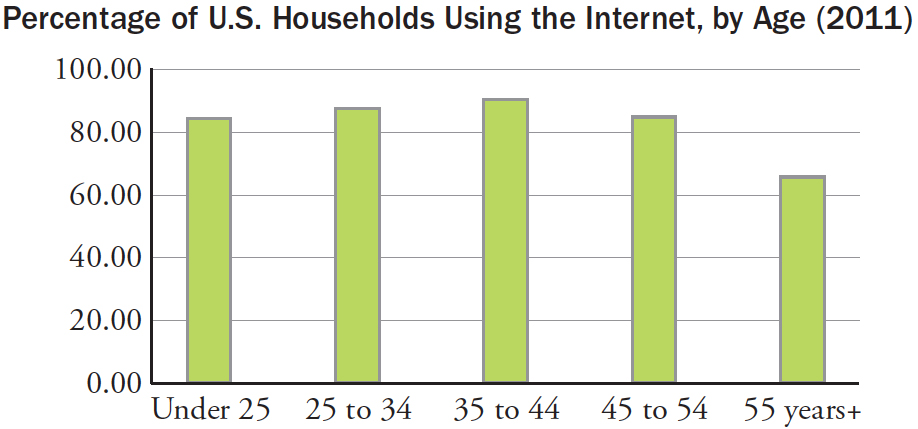
Finally, consider whether the scale or units of measurement are misleading in any way. Reducing the scale, for example, can make differences seem huge, and expanding the scale can make them seem tiny. Compare the bar graph in Figure 4.6 with that in Figure 4.5. The data used in both charts are the same, but because the chart below reduces the scale, it looks as if the difference between the groups is more dramatic than it is.
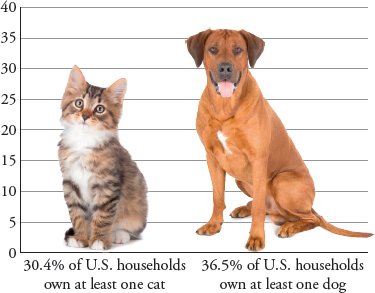
Be especially careful when pictures are used in graphics instead of lines or bars (Figure 4.7). The labels in this graphic clearly indicate that more U.S. households own dogs (36.5%) than own cats (30.4%). But the relative size of the two animals suggests that the percentage difference is much greater than 6.1% (36.5–30.4%). If you looked only at the images, you might assume that dog ownership is much greater than it really is. You might also reasonably conclude that there are more pet dogs than pet cats in the United States, but the labels indicate that the pictures represent households that own at least one cat or dog. Some households may own two, six, or even ten cats. In fact, as of 2013 the American Pet Products Association estimates that there were over 10 million more pet cats than pet dogs in the United States. But you wouldn’t know this from a glance at this graphic.