Graphing an Equation by Plotting Points
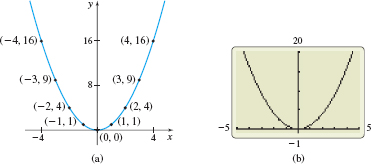
Graph the equation \(y=x^{2}\).
A-17

The graphs in Figure 21 do not show all the points whose coordinates \(( x,y)\) satisfy the equation \(y=x^{2}\). For example, the point \(( 6, 36)\) satisfies the equation \(y=x^{2}\), but it is not shown. It is important when graphing to present enough of the graph so that any viewer will “see” the rest of the graph as an obvious continuation of what is actually there.
Table 4
| \({x}\) | \({y}={x^{2}}\) | \({( {x}, {y})}\) |
|---|---|---|
| \(-4\) | \(16\) | \((-4,16)\) |
| \(-3\) | \(9\) | \((-3,9)\) |
| \(-2\) | \(4\) | \((-2,4)\) |
| \(-1\) | \(1\) | \((-1,1)\) |
| \(0\) | \(0\) | \((0,0)\) |
| \(1\) | \(1\) | \((1,1)\) |
| \(2\) | \(4\) | \((2,4)\) |
| \(3\) | \(9\) | \((3,9)\) |
| \(4\) | \(16\) | \((4,16)\) |
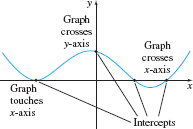
The points, if any, at which a graph crosses or touches a coordinate axis are called the intercepts of the graph. See Figure 22. The \(x\)-coordinate of a point where a graph crosses or touches the \(x\)-axis is an \( x\) -intercept. At an \(x\)-intercept, the \( y\)-coordinate equals \( 0.\) The \(y\)-coordinate of a point where a graph crosses or touches the \(y\) -axis is a \( y\)-intercept. At a \(y\)-intercept, the \(x\)-coordinate equals \(0\). When graphing an equation, all its intercepts should be displayed or be easily inferred from the part of the graph that is displayed.