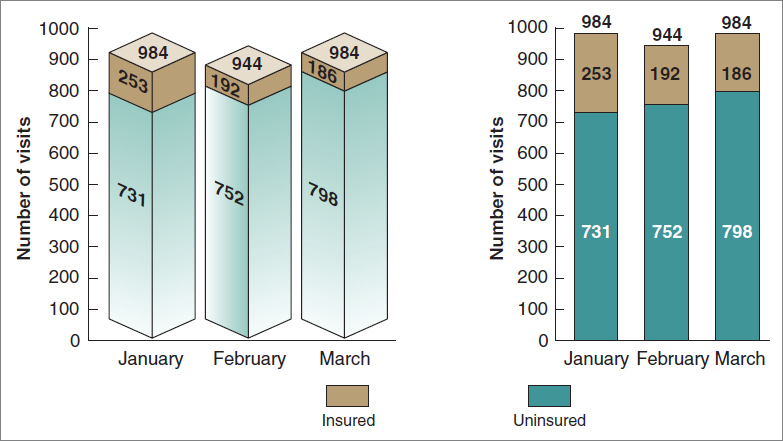
FIGURE 12.1 Chartjunk and Clear Art
Unnecessary 3D is one example of chartjunk, a term used by Tufte (1983) to describe the ornamentation that clutters up a graphic, distracting readers from the message.
The two-dimensional bar graph is clean and uncluttered; the three-dimensional graph is more difficult to understand because the additional dimension obscures the main data points. The number of uninsured emergency-room visits in February, for example, is very difficult to see in the three-dimensional graph.