FIGURE 12.7
Different Graphics Emphasizing Different Points
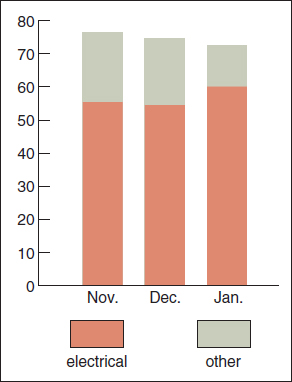
a.
Number of railcars disabled, November–January