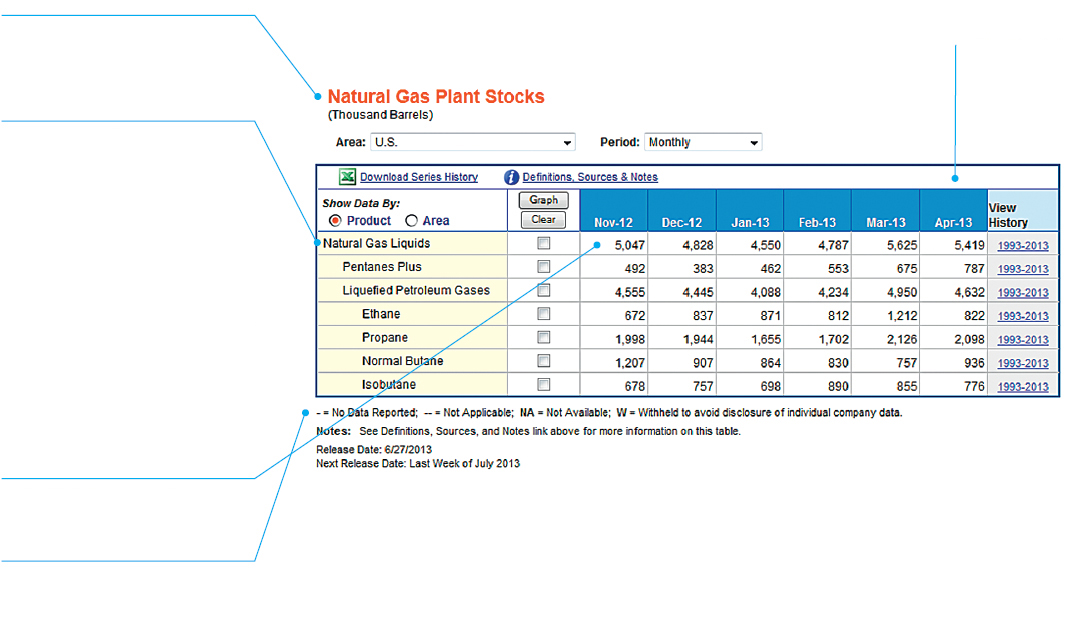
FIGURE 12.8 Parts of a Table
This is an interactive table from the Energy Information Administration showing the amount of natural gas stocks in the United States over a six-month period. Note that you can use the radio buttons to show the data by location or product, and you can use the pull-down menu to specify a time frame. Even though this table is interactive, it functions much the way any table does.
Source: U.S. Energy Information Administration, 2013: www.eia.gov/dnav/pet/pet_stoc_gp_dcu_nus_m.htm.