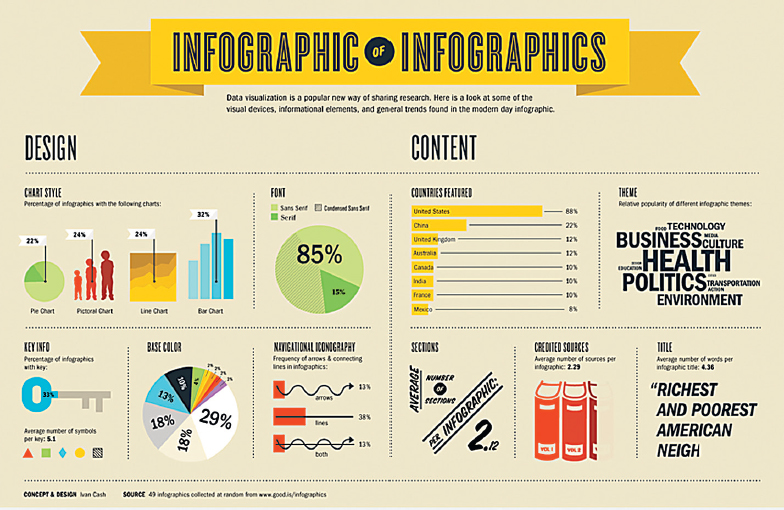
FIGURE 12.11 An Infographic About Infographics
Designer Ivan Cash created this infographic by collecting data about infographics and then creating graphics to make the data interesting and visually appealing.
Infographics are built around basic types of graphical display: pie charts, line graphs, bar graphs, and diagrams. In an effective infographic, each visual display adheres to the conventions of the graphic on which it is based. For instance, in the “Countries Featured” bar graph, the length of each bar accurately reflects the quantity of the item it represents.The art makes the data visually interesting, but the most important characteristic of an infographic is accuracy: the data must be accurate and presented fairly.
Used by permission of Ivan Cash/Cash Studios.