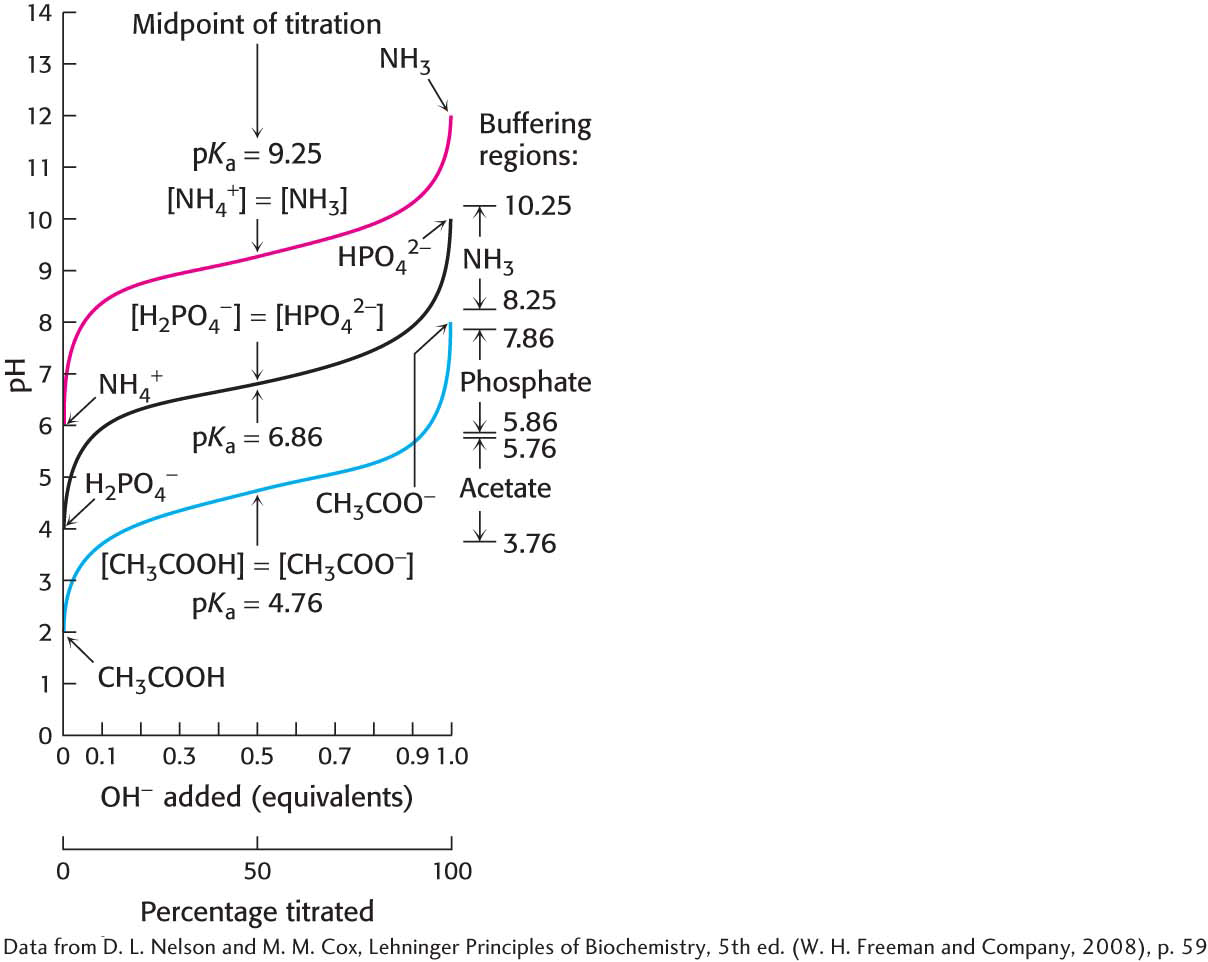
Figure 2.14
The titration curves of three important weak acids
. Notice that the regions of buffering capacity differ.