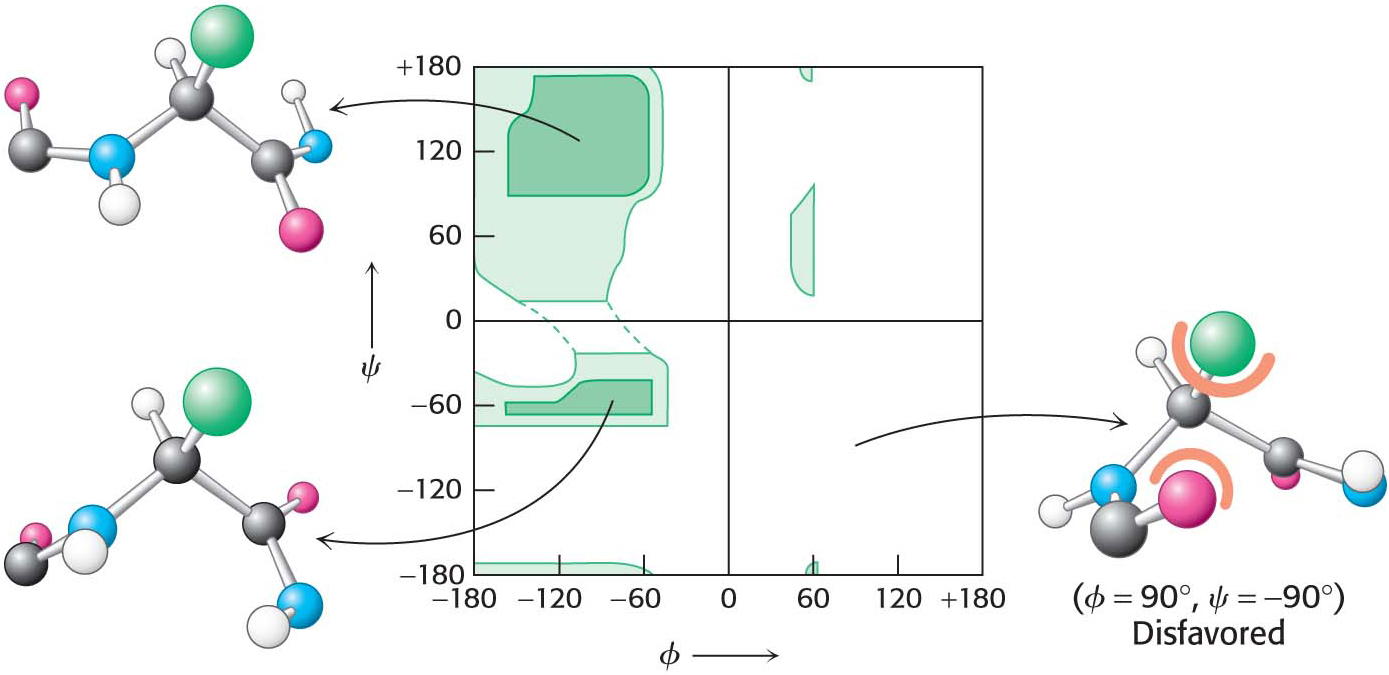
Figure 4.10 A Ramachandran diagram showing the values of ϕ and ψ. Not all ϕ and ψ values are possible without collisions between atoms. The most favorable regions are shown in dark green on the graph; borderline regions are shown in light green. The structure on the right is disfavored because of steric clashes.