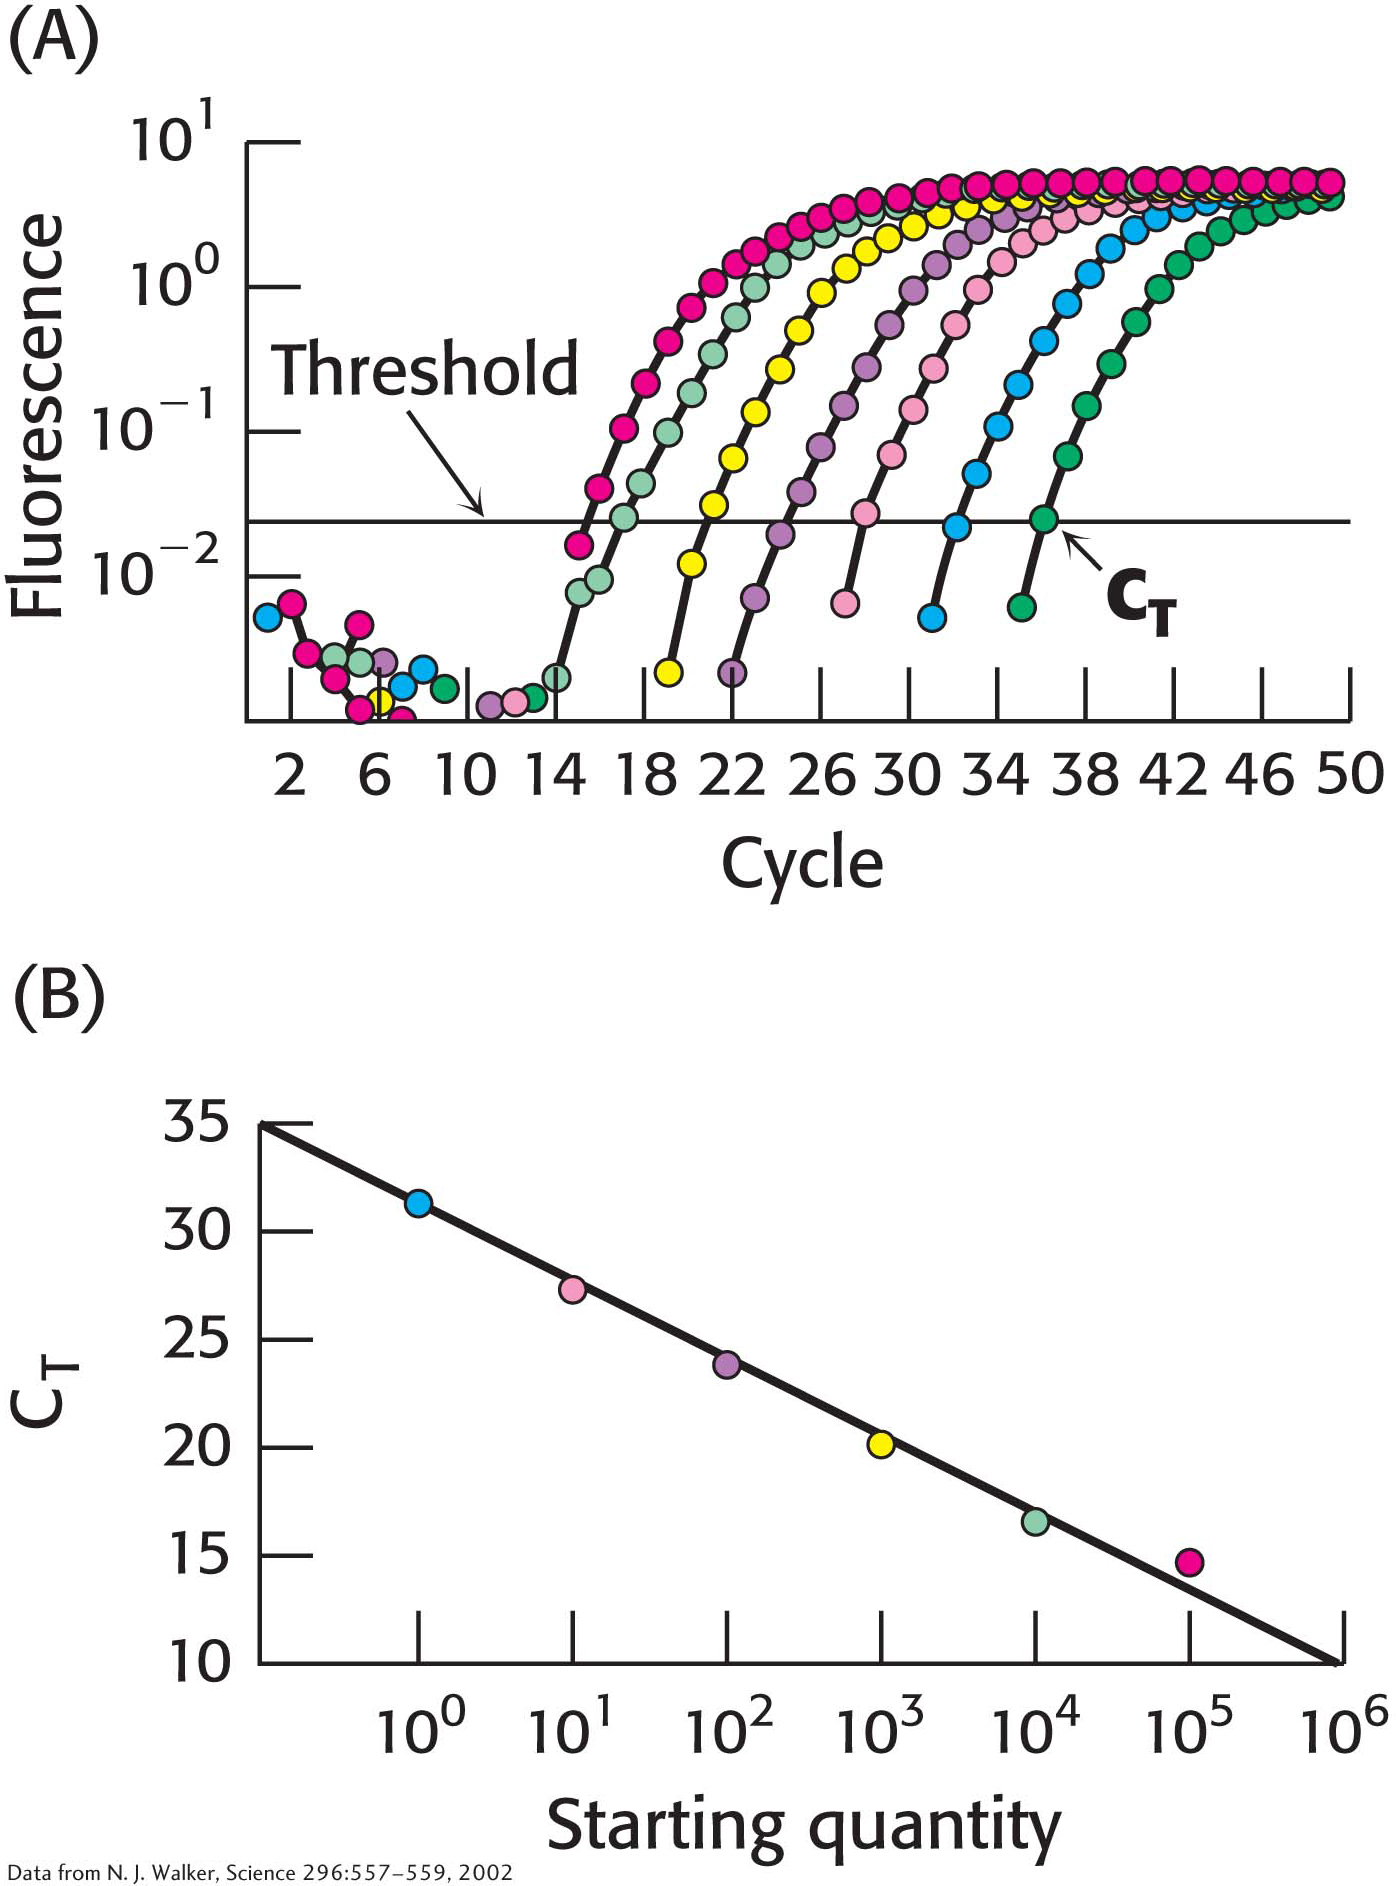
Figure 41.17 Quantitative PCR. (A) In qPCR, fluorescence is monitored in the course of PCR amplification to determine CT, the cycle at which this signal exceeds a defined threshold. Each color represents a different starting quantity of DNA. (B) CT values are inversely proportional to the number of copies of the original cDNA template.