17.2 Gluconeogenesis and Glycolysis Are Reciprocally Regulated
✓ 4 Describe the coordinated regulation of glycolysis and gluconeogenesis.
Gluconeogenesis and glycolysis are coordinated so that, within a cell, one pathway is relatively inactive while the other one is highly active. If both sets of reactions were highly active at the same time, the net result would be the hydrolysis of four nucleoside triphosphates (two ATP molecules plus two GTP molecules) per reaction cycle. Both glycolysis and gluconeogenesis are exergonic under cellular conditions, and so there is no thermodynamic barrier to such simultaneous activity. However, the activities of the distinctive enzymes of each pathway are controlled so that both pathways are not highly active at the same time. The rate of glycolysis is also determined by the concentration of glucose, and the rate of gluconeogenesis is controlled by the concentrations of lactate and other precursors of glucose. The basic premise of the reciprocal regulation is that, when glucose is abundant, glycolysis will predominate. When glucose is scarce, gluconeogenesis will take over.
Energy Charge Determines Whether Glycolysis or Gluconeogenesis Will Be More Active
The key regulation site in the gluconeogenesis pathway is the interconversion of fructose 6-phosphate and fructose 1,6-bisphosphate (Figure 17.6). Consider first a situation in which energy is needed. In this case, the concentration of AMP is high. Under this condition, AMP stimulates phosphofructokinase but inhibits fructose 1,6-bisphosphatase. Thus, glycolysis is turned on and gluconeogenesis is inhibited. Conversely, high levels of ATP and citrate indicate that the energy charge is high and that biosynthetic intermediates are abundant. ATP and citrate inhibit phosphofructokinase, whereas citrate activates fructose 1,6-bisphosphatase. Under these conditions, glycolysis is nearly switched off and gluconeogenesis is promoted. Why does citrate take part in this regulatory scheme? As we will see in Chapter 19, citrate reports on the status of the citric acid cycle, the primary pathway for oxidizing fuels in the presence of oxygen. High levels of citrate indicate an energy-rich situation and the presence of precursors for biosynthesis, most notably fatty acid synthesis (Chapter 28).
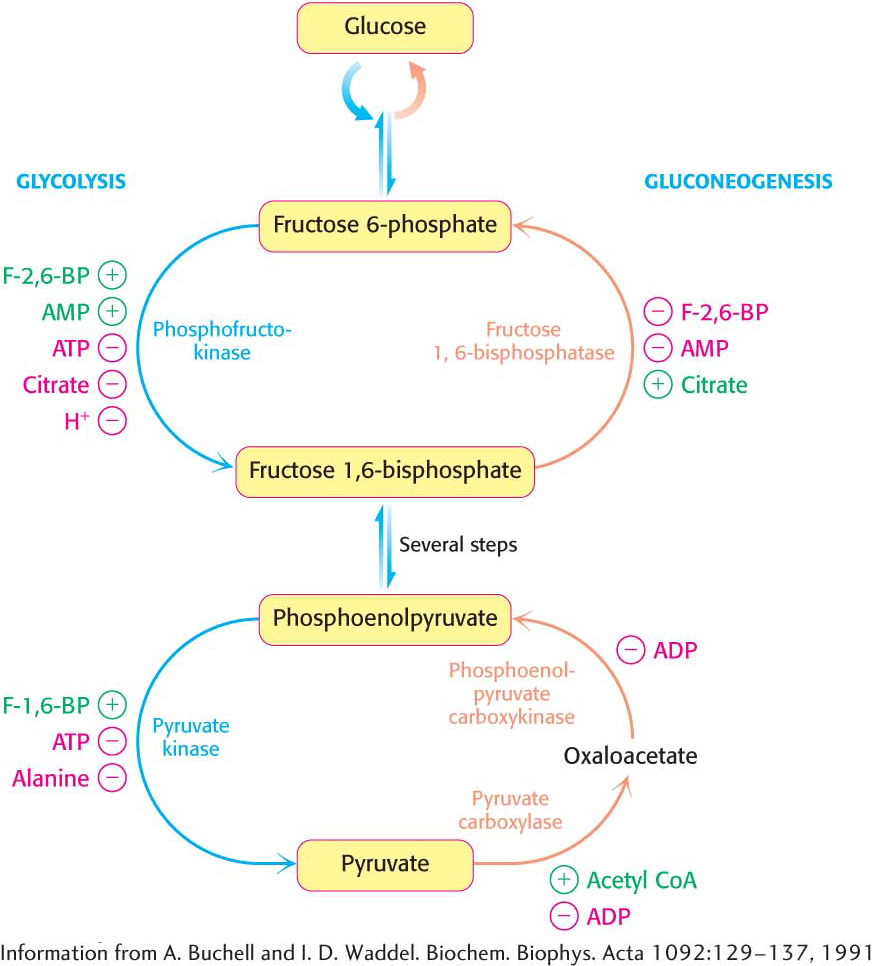
Figure 17.6: The reciprocal regulation of gluconeogenesis and glycolysis in the liver. The level of fructose 2,6-bisphosphate (F-2,6-BP) is high in the fed state and low in starvation. Another important control is the inhibition of pyruvate kinase by phosphorylation during starvation.
Glycolysis and gluconeogenesis are also reciprocally regulated at the interconversion of phosphoenolpyruvate and pyruvate in the liver. The glycolytic enzyme pyruvate kinase is inhibited by allosteric effectors ATP and alanine, which signal that the energy charge is high and that building blocks are abundant. Conversely, pyruvate carboxylase, which catalyzes the first step in gluconeogenesis from pyruvate, is inhibited by ADP. Likewise, ADP inhibits phosphoenolpyruvate carboxykinase. Pyruvate carboxylase is activated by acetyl CoA, which, like citrate, indicates that the citric acid cycle is producing energy and biosynthetic intermediates (Chapter 19). Hence, when the cell is rich in biosynthetic precursors and ATP, anabolic pathways are favored. In the liver, gluconeogenesis can produce glucose to replenish glycogen stores (Chapter 25) and fatty acid synthesis can take place.
The Balance Between Glycolysis and Gluconeogenesis in the Liver Is Sensitive to Blood-Glucose Concentration
In the liver, rates of glycolysis and gluconeogenesis are adjusted to maintain blood-glucose concentration. Recall that fructose 2,6-bisphosphate is a potent activator of phosphofructokinase (PFK), the primary regulatory enzyme in glycolysis. Fructose 2,6-bisphosphate is also an inhibitor of fructose 1,6-bisphosphatase. When blood glucose concentration is low, fructose 2,6-bisphosphate is dephosphorylated to form fructose 6-phosphate, which no longer binds to PFK. How is the amount of fructose 2,6-bisphosphate controlled to rise and fall with blood-glucose concentration? Two enzymes regulate the concentration of this molecule: one phosphorylates fructose 6-phosphate, and the other dephosphorylates fructose 2,6-bisphosphate. Fructose 2,6-bisphosphate is formed from fructose 6-phosphate in a reaction catalyzed by phosphofructokinase 2 (PFK2), a different enzyme from phosphofructokinase. In the reverse direction, fructose 6-phosphate is formed through the hydrolysis of fructose 2,6-bisphosphate by a specific phosphatase, fructose bisphosphatase 2 (FBPase2). The striking finding is that both PFK2 and FBPase2 are present in a single 55-kDa polypeptide chain (Figure 17.7). This bifunctional enzyme contains an N-terminal regulatory domain, followed by a kinase domain and a phosphatase domain.
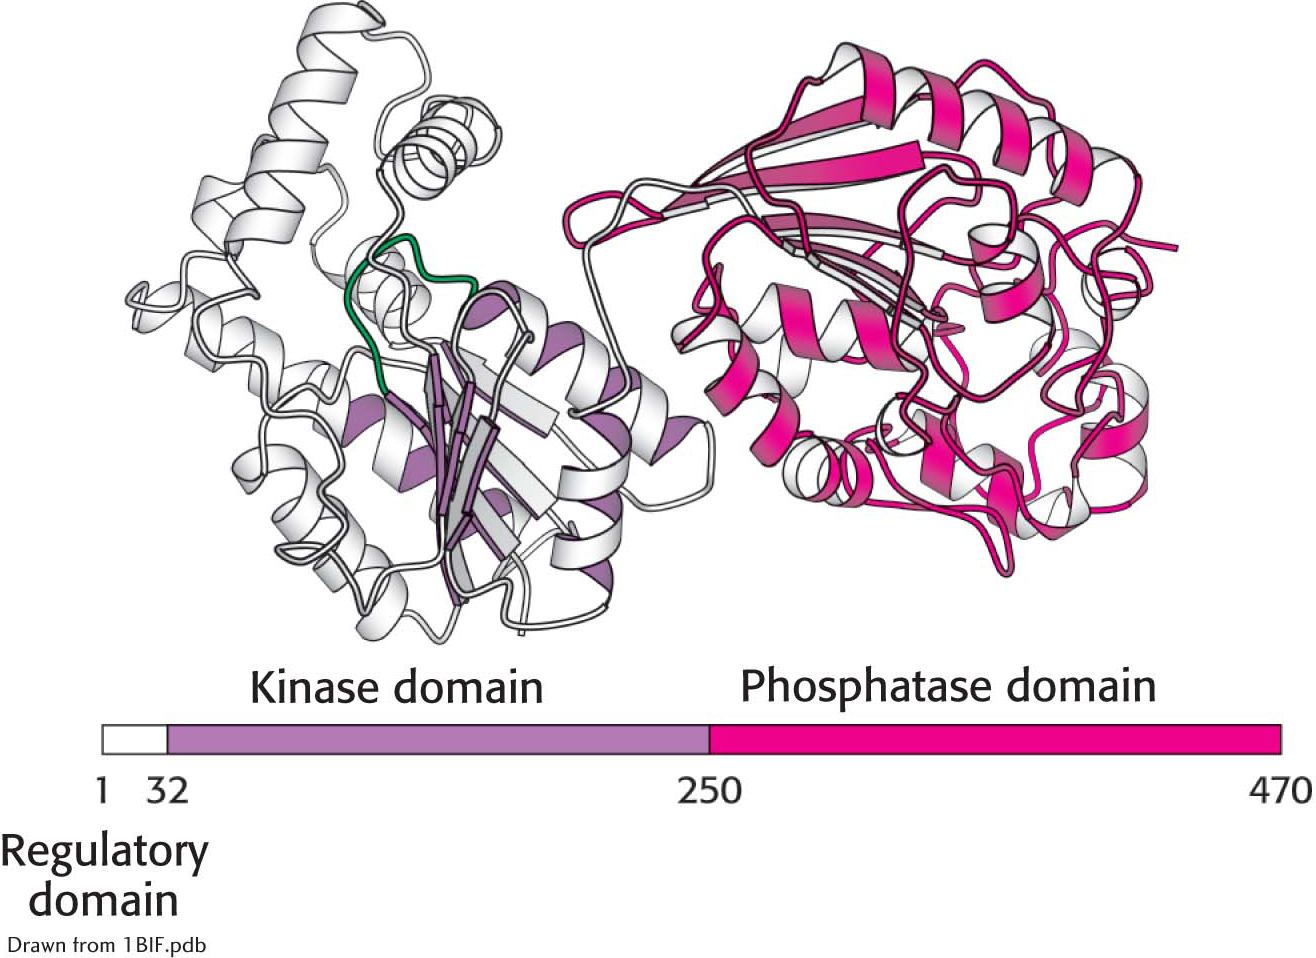
Figure 17.7:  The domain structure of the bifunctional regulatory enzyme phosphofructokinase 2/fructose 2,6-bisphosphatase. The kinase domain (purple) is fused to the phosphatase domain (red). The bar represents the amino acid sequence of the enzyme.
What controls whether PFK2 or FBPase2 dominates the bifunctional enzyme’s activities in the liver? The activities of PFK2 and FBPase2 are reciprocally controlled by the phosphorylation of a single serine residue. When glucose is scarce, as it is during a night’s fast, a rise in the blood concentration of the hormone glucagon triggers a cyclic AMP signal cascade, leading to the phosphorylation of this bifunctional enzyme by protein kinase A (Figure 17.8). This covalent modification activates FBPase2 and inhibits PFK2, lowering the concentration of F-2,6-BP. Gluconeogenesis predominates. Glucose formed by the liver under these conditions is essential for the viability of the brain. Glucagon stimulation of protein kinase A also inactivates pyruvate kinase in the liver.
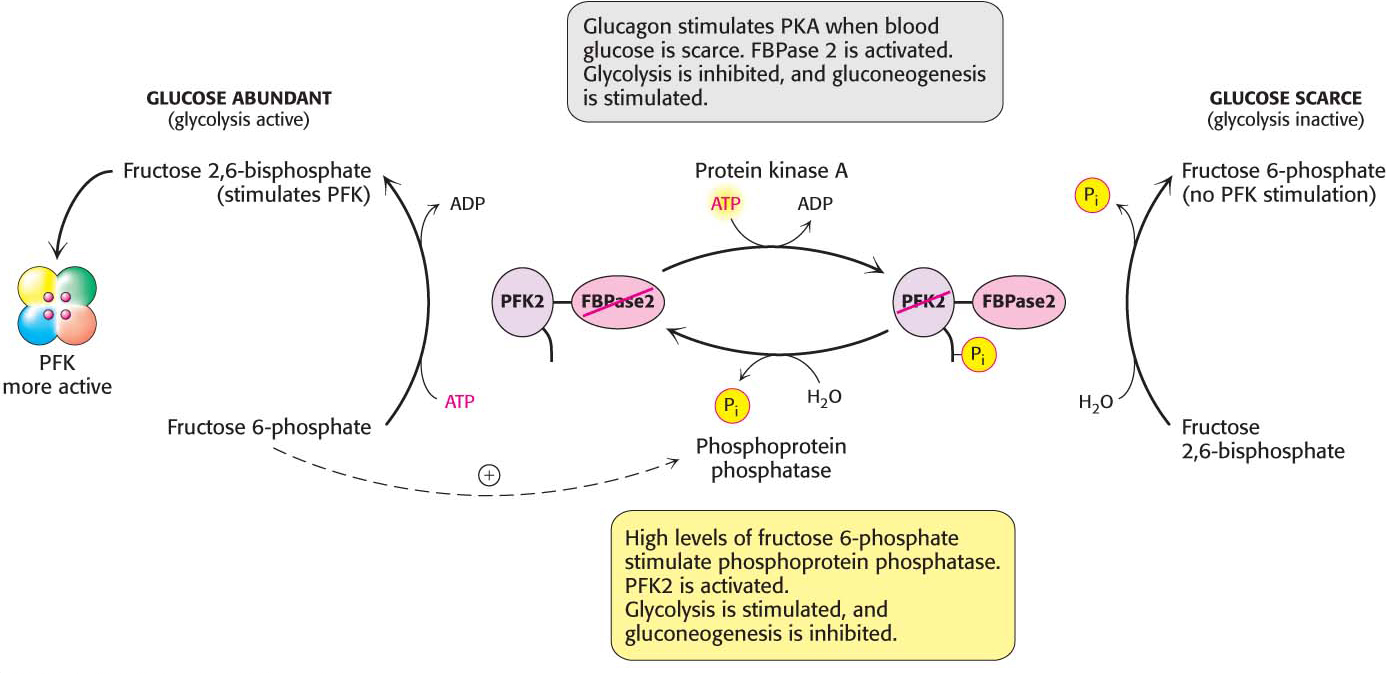
Figure 17.8: Control of the synthesis and degradation of fructose 2,6-bisphosphate. A low blood-glucose level as signaled by glucagon leads to the phosphorylation of the bifunctional enzyme and, hence, to a lower level of fructose 2,6-bisphosphate, slowing glycolysis. High levels of fructose 6-phosphate accelerate the formation of fructose 2,6-bisphosphate by facilitating the dephosphorylation of the bifunctional enzyme.
!quickquiz! QUICK QUIZ 2
What are the regulatory means that prevent high levels of activity in glycolysis and gluconeogenesis simultaneously? What would be the result if both pathways functioned rapidly at the same time?
Conversely, when blood glucose is abundant, as it is after a meal, glucagon concentration in the blood falls and the insulin concentration rises. Now, gluconeogenesis is not needed and the phosphoryl group is removed from the bifunctional enzyme. This covalent modification activates PFK2 and inhibits FBPase2. The resulting increase in the concentration of F-2,6-BP accelerates glycolysis. The coordinated control of glycolysis and gluconeogenesis is facilitated by the location of the kinase and phosphatase domains on the same polypeptide chain as the regulatory domain.
Figure 17.9: Diet can help to prevent the development of type 2 diabetes. A healthy diet, one rich in fruits and vegetables, is an important step in preventing or treating type 2 diabetes.
!clinic! CLINICAL INSIGHT: Insulin Fails to Inhibit Gluconeogenesis in Type 2 Diabetes
Insulin, the hormone that signals the presence of fuels in the blood, or the fed state, normally inhibits gluconeogenesis. When glucose is present in the blood after a meal, there is no need to synthesize glucose. Recall from Chapter 13 that insulin normally starts a signaling cascade that increases the expression of genes that encode the proteins of glycolysis. Insulin also turns off the gene that encodes phosphoenolpyruvate carboxykinase (PEPCK), thereby inhibiting gluconeogenesis. However, in type 2 diabetes (non-insulin-dependent diabetes), insulin, although present, fails to inhibit the expression of the gene that encodes PEPCK and other genes of gluconeogenesis. This metabolic circumstance is called insulin resistance and is the defining feature of type 2 diabetes. The higher-than-normal concentration of PEPCK results in an increased output of glucose by the liver even when glucose from the diet is present. Blood glucose rises to abnormally high levels (hyperglycemia). The high concentration of blood glucose alters blood osmolarity resulting in loss of water from tissues and the secretion of vasopressin (also called antidiuretic hormone, ADH), causing excessive thirst (polydipsia). Excess glucose, along with water, is excreted by the kidneys resulting in frequent urination (polyuria). Blurred vision, fatigue, and headache are caused by the lack of energy due to the inability to use glucose as a fuel. The cause of type 2 diabetes, the most common metabolic disease in the world, is unknown, although obesity may be a contributing factor. Untreated, type 2 diabetes can progress to insulin-dependent diabetes. The treatment of type 2 diabetes includes weight loss, a healthy diet, exercise, and drug treatment to enhance sensitivity to insulin (Figure 17.9).
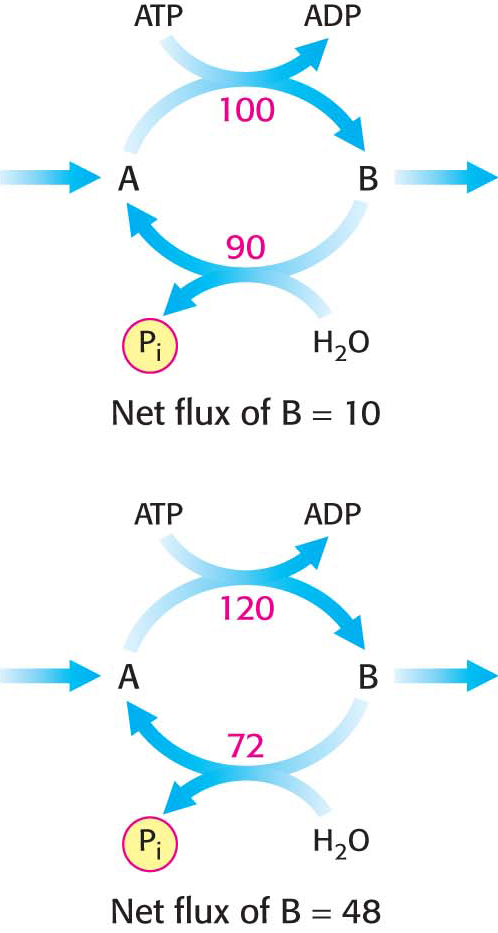
Figure 17.10: A substrate cycle. This ATP-driven cycle operates at two different rates. A small change in the rates of the two opposing reactions results in a large change in the net flux of product B.
!clinic! CLINICAL INSIGHT: Substrate Cycles Amplify Metabolic Signals
A pair of reactions such as the phosphorylation of fructose 6-phosphate to fructose 1,6-bisphosphate in the glycolytic pathway and its hydrolysis back to fructose 6-phosphate in the gluconeogenic pathway is called a substrate cycle. As already mentioned, both reactions are not simultaneously fully active in most cells, because of reciprocal allosteric controls. However, the results of isotope-labeling studies have shown that some fructose 6-phosphate is phosphorylated to fructose 1,6-bisphosphate even in gluconeogenesis. There is also a limited degree of cycling in other pairs of opposed irreversible reactions. This cycling was regarded as an imperfection in metabolic control, and so substrate cycles have sometimes been called futile cycles. Indeed, there are pathological conditions, such as malignant hyperthermia, in which control is lost and opposing pathways proceed rapidly. In malignant hyperthermia, there is rapid, uncontrolled hydrolysis of ATP, which generates heat and can raise body temperature to 44°C (111°F). Muscles may become rigid and severely damaged as well.
Despite such extraordinary circumstances, substrate cycles now seem likely to be biologically important. One possibility is that substrate cycles amplify metabolic signals. Suppose that the rate of conversion of A into B is 100 and of B into A is 90, giving an initial net flux of 10. Assume that an allosteric effector increases the A S B rate by 20% to 120 and reciprocally decreases the B → A rate by 20% to 72. The new net flux is 48, and so a 20% change in the rates of the opposing reactions has led to a 380% increase in the net flux. In the example shown in Figure 17.10, this amplification is made possible by the rapid hydrolysis of ATP. The flux of each step of the glycolytic pathway has been suggested to increase as much as 1000-fold at the initiation of intense exercise, when a lot of ATP is needed. Because the allosteric activation of enzymes alone seems unlikely to explain this increased flux, the existence of substrate cycles may partly account for the rapid rise in the rate of glycolysis.