Complementary DNA Prepared from mRNA Can Be Expressed in Host Cells
How can mammalian DNA be cloned and expressed by E. coli? Recall that most mammalian genes are mosaics of introns and exons. These interrupted genes cannot be expressed by bacteria, which lack the machinery to splice introns out of the primary transcript. However, this difficulty can be circumvented by introducing recombinant DNA that is complementary to mature mRNA, or cDNA, into the bacteria. For example, proinsulin, a precursor of insulin, is synthesized by bacteria harboring plasmids that contain DNA complementary to mRNA for proinsulin (Figure 41.6). Indeed, bacteria produce much of the insulin used today by millions of diabetics.
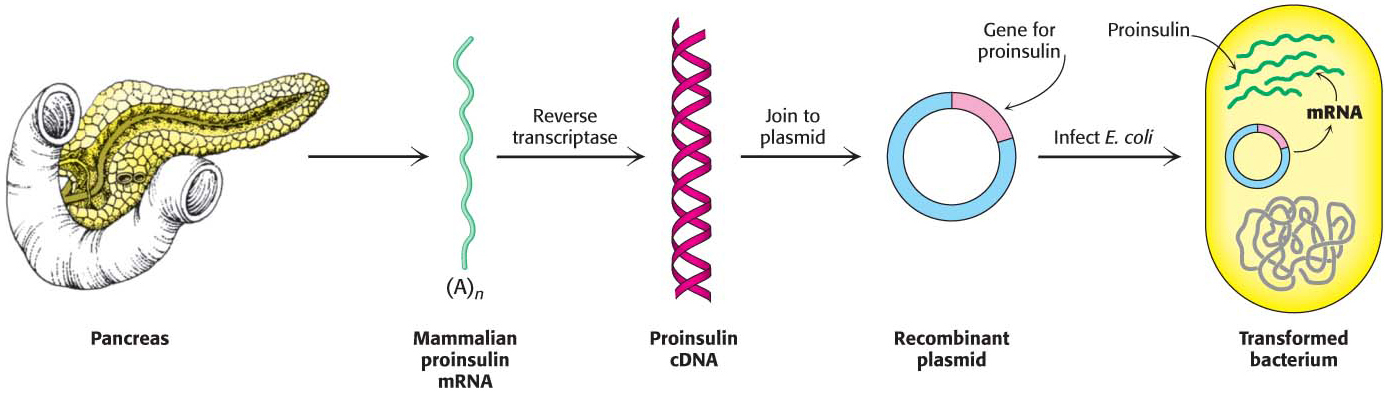
Figure 41.6: Synthesis of proinsulin by bacteria. Proinsulin, a precursor of insulin, can be synthesized by transformed (genetically altered) clones of E. coli. The clones contain the mammalian DNA encoding proinsulin.
DID YOU KNOW?
Retroviruses contain an RNA genome but replicate through a DNA intermediate. The conversion of RNA information into DNA information is catalyzed by reverse transcriptase. Human immunodeficiency virus (HIV), the cause of AIDS, is a retrovirus.
!quickquiz! QUICK QUIZ
Why are restriction enzymes such vital tools for recombinant DNA technology?
The key to forming complementary DNA is the enzyme reverse transcriptase, an RNA-directed DNA polymerase isolated from retroviruses. Reverse transcriptase synthesizes a DNA strand complementary to an RNA template if the transcriptase is provided with a DNA primer that is base-paired to the RNA and contains a free 3′-OH group. We can use a simple sequence of linked thymidine, or oligo(T), residues as the primer. This oligo(T) sequence pairs with the poly(A) sequence at the 3′ end of most eukaryotic mRNA molecules, as shown in Figure 41.7. Reverse transcriptase then synthesizes the rest of the cDNA strand in the presence of the four deoxyribonucleoside triphosphates. The RNA strand of this RNA–DNA hybrid is subsequently hydrolyzed by raising the pH. Unlike RNA, DNA is resistant to alkaline hydrolysis. The single-stranded DNA is converted into double-stranded DNA by creating another primer site. The enzyme terminal transferase adds nucleotides—for instance, several residues of dG—to the 3′ end of the single-stranded DNA to act as a platform for the primer. Oligo(dC) can bind to dG residues and prime the synthesis of the second DNA strand. The second DNA strand is synthesized as it would be in nature, with DNA polymerase and dNTPs. Synthetic linkers, segments of DNA synthesized to contain several restriction sites, can be added to this double-helical DNA for ligation to a suitable vector. Complementary DNA for all mRNA that a cell contains can be made, inserted into such vectors, and then inserted into bacteria. Thus, each bacterium will contain a vector with an inserted piece of DNA as well as its own circular chromosomes. Such a collection of vectors constitutes a cDNA library.
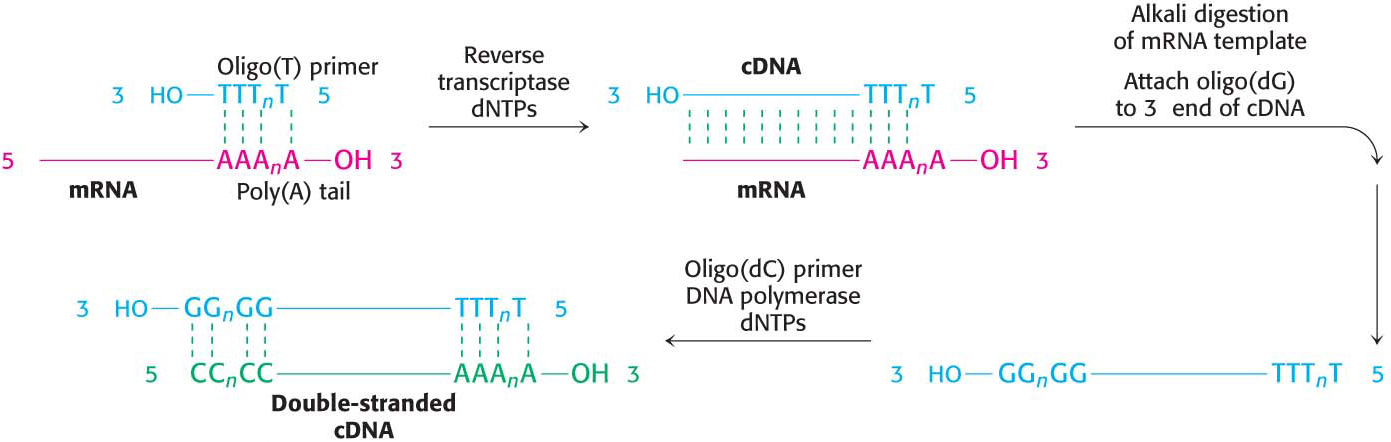
Figure 41.7: Formation of a cDNA duplex. A complementary DNA (cDNA) duplex is created from mRNA by using reverse transcriptase to synthesize a cDNA strand—first, along the mRNA template and, then, after digestion of the mRNA, along that same newly synthesized cDNA strand.
Estrogen-Receptor cDNA Can Be Identified by Screening a cDNA Library
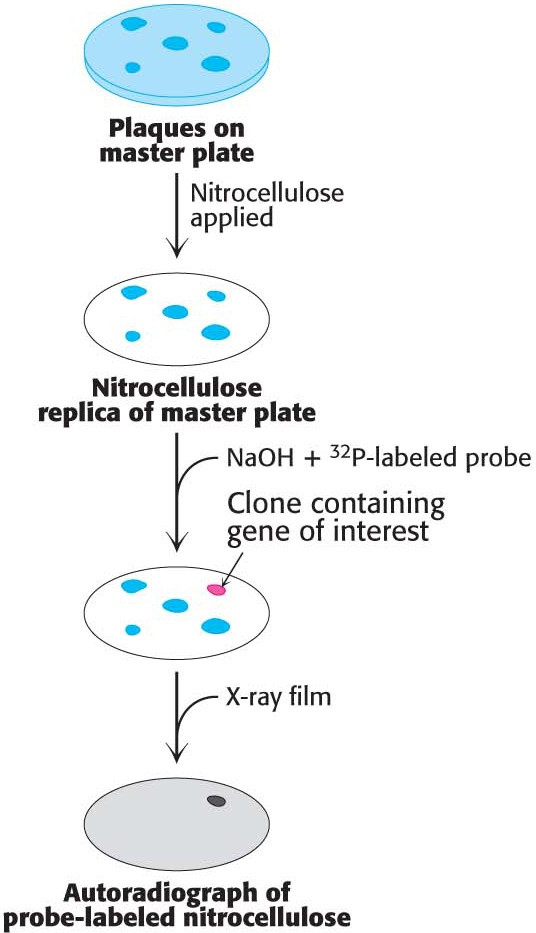
Figure 41.8: Screening a cDNA library for a specific gene. Here, a plate is tested for plaques containing cDNA for the estrogen receptor.
With these techniques at our disposal, let us return to our experiments with the estrogen receptor. We will use the probe that we synthesized earlier to screen a cDNA library generated from an estrogen-responsive tissue, such as a rat uterus. For our experiments, we will use a λ phage cDNA library.
A dilute suspension of the recombinant phages is first plated on a lawn of bacteria (Figure 41.8). Where each phage particle has landed and infected a bacterium, a plaque containing identical phages develops on the plate. A replica of this master plate is then made by applying a sheet of nitrocellulose. Infected bacteria and phage DNA released from lysed cells adhere to the sheet in a pattern of spots corresponding to the plaques. Intact bacteria on this sheet are lysed with NaOH, which also serves to denature the DNA so that it becomes accessible for hybridization with a 32P-labeled single-stranded probe. The probe will bind only to the DNA sequence encoding the estrogen-receptor cDNA. Autoradiography of the replica then reveals the positions of spots harboring recombinant DNA. The corresponding plaques are picked out of the intact master plate and grown. A single investigator can readily screen a million clones in a day.
The vector containing the cDNA for the estrogen receptor can be isolated and transcribed. The resulting mRNA can be translated in vitro to produce receptor for experiments.
Complementary DNA Libraries Can Be Screened for Synthesized Protein
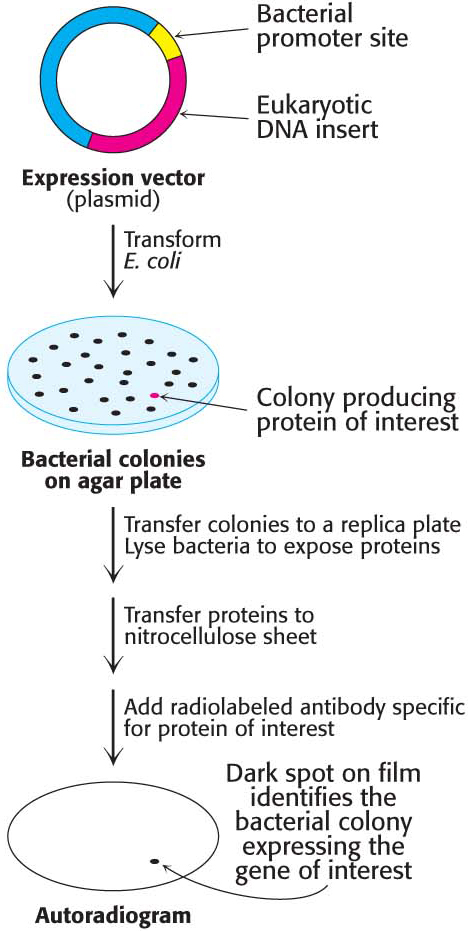
Figure 41.9: Screening expression vectors for the presence of the estrogen receptor. A method of screening for cDNA clones is to identify expressed protein products by staining with specific antibody.
The vectors discussed so far simply carry the incorporated DNA and allow for the transcription of the inserted DNA. However, with the use of a specially prepared vector, bacteria that are actually expressing the estrogen-receptor protein can be isolated. Complementary DNA molecules can be inserted into specially engineered vectors that favor the efficient expression of these molecules in hosts such as E. coli. Such plasmids or phages are called expression vectors. These vectors maximize the transcription of the inserted DNA by using a powerful promoter. Expression vectors also contain a segment of DNA that encodes a ribosome-binding site on the mRNA that is transcribed from the inserted cDNA. Thus, cDNA molecules that are inserted into these vectors are not only transcribed but also translated. Clones containing the cDNA can be screened on the basis of their capacity to direct the synthesis of a foreign protein in bacteria. Spots of bacteria on a replica plate are lysed to release proteins, which bind to an applied nitrocellulose filter. With the use of immunological techniques similar to those mentioned in Chapter 5, the monoclonal antibody for the estrogen receptor can be used to identify colonies of bacteria that harbor the corresponding cDNA vector (Figure 41.9).
Having a cDNA for the estrogen receptor enables us to perform a number of experiments to determine the biochemical properties of the protein. For instance, we learned earlier that the estrogen receptor is a transcription factor that functions by binding to the DNA of select genes. By using the cloned receptor, we can perform experiments to determine the DNA sequence to which the receptor binds most tightly. We could investigate whether the receptor reacts with other proteins when binding to DNA. Indeed, the knowledge to be gained is limited only by our imagination and experimental skill. However, having cDNA for the receptor tells us little about the gene that encodes the receptor itself. Does the gene contain introns? What regulatory sequences control its expression? To answer these questions and similar ones, we must isolate the gene that encodes the receptor. To do so, we return to a library, but this time to a genomic library.
Specific Genes Can Be Cloned from Digests of Genomic DNA
Let us see how we can clone a gene that is present just once in a haploid genome, such as the gene encoding the estrogen receptor. The approach is to prepare a large collection (library) of fragments of genomic DNA and then to identify those members of the collection that have the gene of interest.
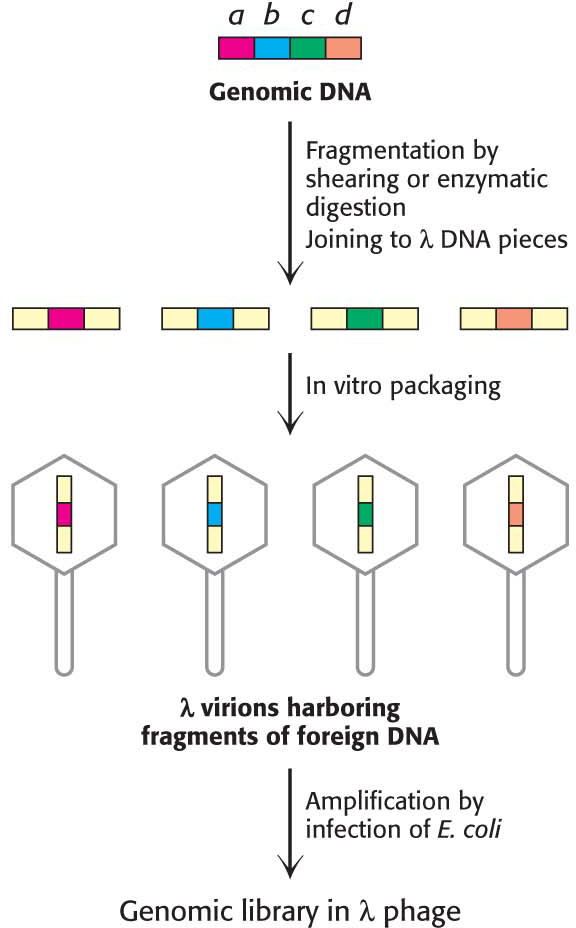
Figure 41.10: Creating a genomic library. A genomic library can be created from a digest of a whole complex genome.
A sample containing many copies of total genomic DNA—in our case, rat DNA—is first mechanically sheared or partly digested by restriction enzymes into large fragments. This process yields a nearly random population of overlapping DNA fragments. These fragments are then separated by gel electrophoresis to isolate the set of all fragments that are about 15 kb long because this size is convenient for insertion into vectors. Synthetic linkers are attached to the ends of these fragments, cohesive ends are formed, and the fragments are then inserted into a vector, such as λ phage DNA, prepared with the same cohesive ends (Figure 41.10). E. coli bacteria are then infected with these recombinant phages. These phages replicate themselves and then lyse their bacterial hosts. The resulting lysate contains fragments of rat DNA housed in a sufficiently large number of virus particles to ensure that the entire genome is represented. These phages constitute a genomic library. This genomic library is then screened in a similar fashion to the screening of a cDNA library.
The gene of interest is unlikely to be found in one piece of DNA, because genes are usually larger than 15 kb, the size of the fragments used to make the genomic library. Consequently, several clones from the genomic library will harbor different parts of the gene for the estrogen receptor. These clones must be isolated and sequenced to determine the sequence of the entire gene.
DNA Can Be Sequenced by the Controlled Termination of Replication
The analysis of DNA structure and its role in gene expression also have been markedly facilitated by the development of powerful techniques for the sequencing of DNA molecules. The key to DNA sequencing is the generation of DNA fragments whose length is determined by the last base in the sequence. Collections of such fragments can be generated through the controlled termination of replication (Sanger dideoxy method), a method developed by Frederick Sanger and his coworkers. The same procedure is performed on four reaction mixtures at the same time. In all these mixtures, a DNA polymerase is used to make the complement of a short sequence within a single-stranded DNA molecule that is being sequenced. The synthesis is primed by a chemically synthesized fragment that is complementary to a part of the sequence. In addition to the four deoxyribonucleoside triphosphates (radioactively labeled), each reaction mixture contains a small amount of the 2′, 3′-dideoxy analog of one of the nucleotides, a different nucleotide for each reaction mixture.
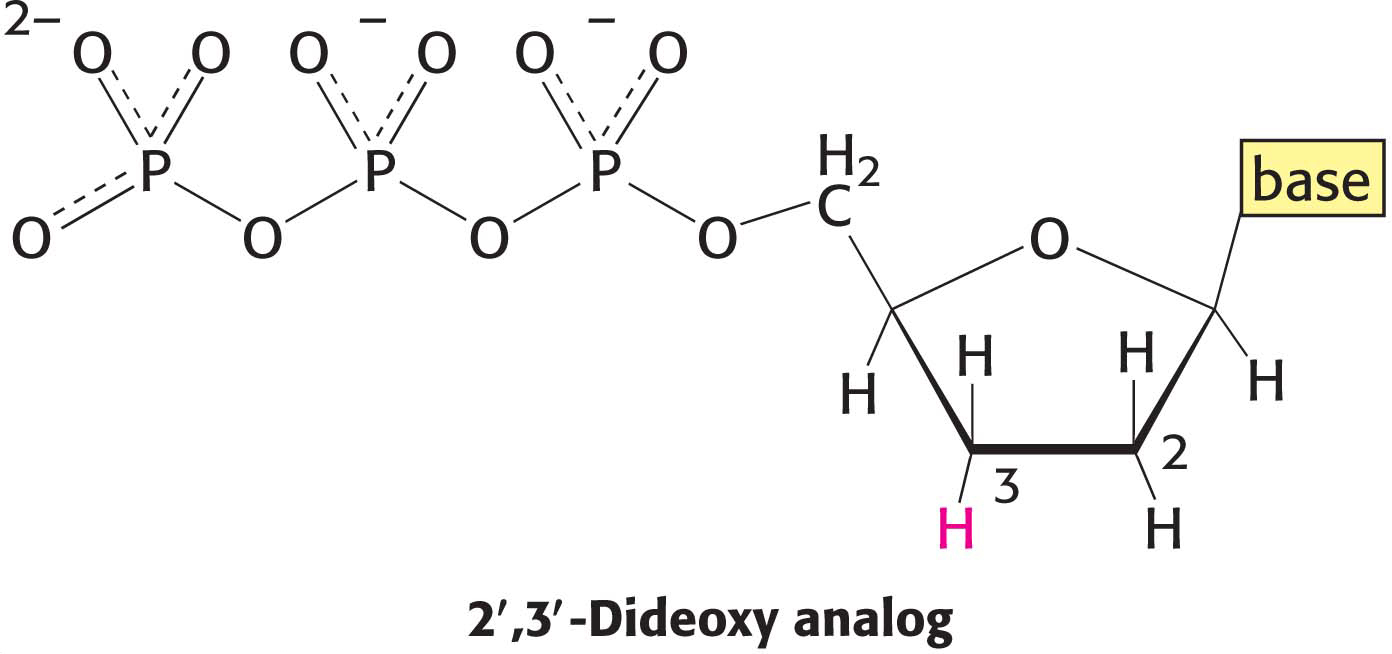
The incorporation of this analog blocks further growth of the new strand because the dideoxy analog lacks the 3′-hydroxyl terminus needed to form the next phosphodiester linkage. The concentration of the analog is low enough that strand termination will take place only occasionally. The polymerase will insert the correct nucleotide sometimes and the dideoxy analog other times, stopping the reaction. For instance, if the dideoxy analog of dATP (ddATP) is present, fragments of various lengths are produced, but all will be terminated by ddATP (Figure 41.11). Importantly, ddATP will be inserted only where a T was located in the DNA being sequenced. Thus, the fragments of different length will correspond to the positions of T. Four such sets of strand-terminated fragments (one for each dideoxy analog) then undergo electrophoresis, and the base sequence of the new DNA is read from the autoradiogram of the four lanes.
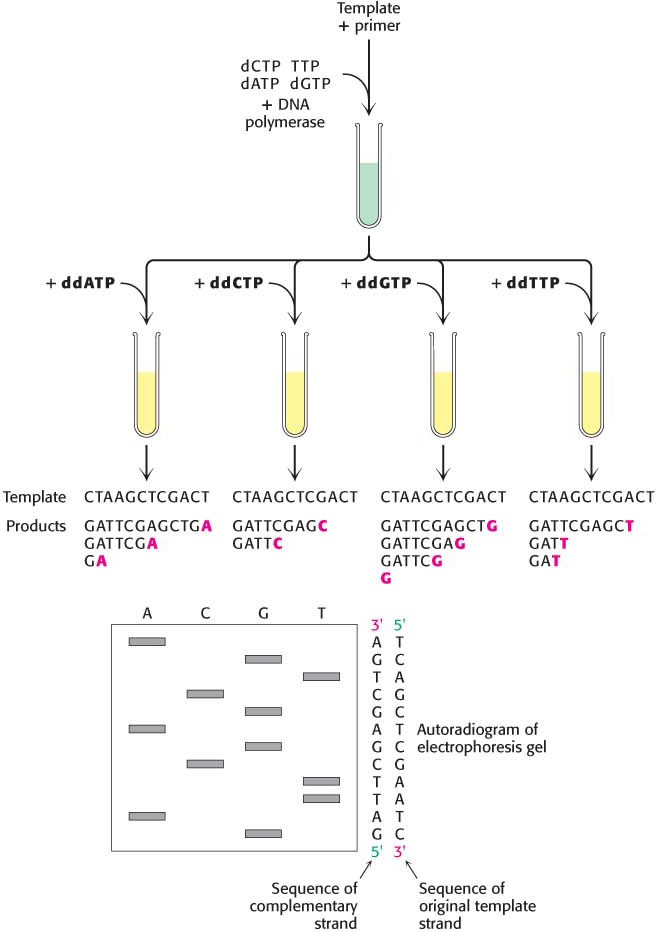
Figure 41.11: Strategy of the strand-termination method for sequencing DNA. Fragments are produced by adding the 2′,3′-dideoxy analog of a dNTP to each of four polymerization mixtures. For example, the addition of the dideoxy analog of dATP results in fragments ending in A. The strand cannot be extended past the dideoxy analog.
Fluorescence detection is a highly effective alternative to autoradiography. A fluorescent tag is incorporated into each dideoxy analog—a differently colored one for each of the four strand terminators (e.g., a blue emitter for termination at A and a red one for termination at C). With the use of a mixture of terminators, a single reaction can be performed and the resulting fragments are then subjected to electrophoresis. The separated bands of DNA are detected by their fluorescence as they emerge subsequent to electrophoresis; the sequence of their colors yields the base sequence directly (Figure 41.12). Fluorescence detection is attractive because it eliminates the use of radioactive reagents and can be readily automated. Indeed, modern DNA-sequencing instruments can sequence millions of bases per day with the use of this method.
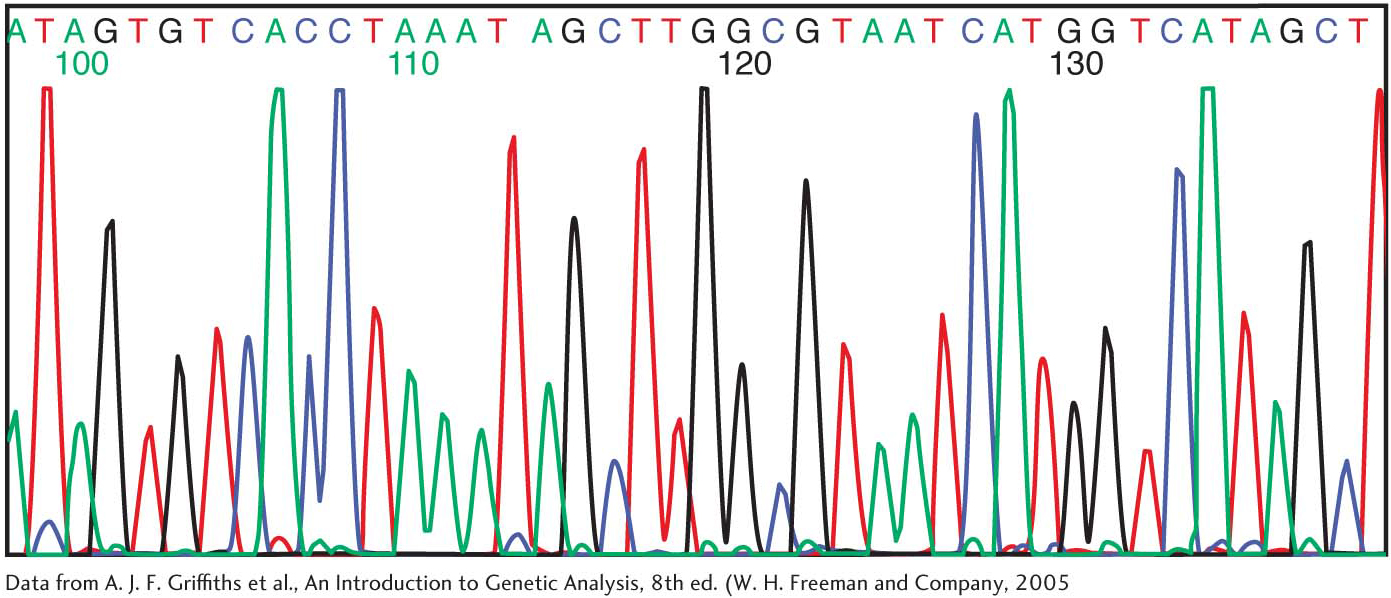
Figure 41.12: Fluorescence detection of oligonucleotide fragments produced by the dideoxy method. A sequencing reaction is performed with four strand-terminating dideoxy nucleotides, each labeled with a tag that fluoresces at a different wavelength (e.g., red for T). Each of the four colors represents a different base in a chromatographic trace produced by fluorescence measurements at four wavelengths.
Applying such sequencing tools to the investigation of the gene for the estrogen receptor reveals that the gene is more than 140 kb in length and contains eight exons. In addition to TATA and CAAT boxes, the upstream region of the gene contains a P1 promoter that is activated by the transcription factor AP2γ. Interestingly, certain breast cancers depend on the presence of the estrogen receptor for malignant growth, and AP2γ may play a critical role in the regulation of the gene for the estrogen receptor in cancer cells.
!clinic!!bio! CLINICAL AND BIOLOGICAL INSIGHT: Next-Generation Sequencing Methods Enable the Rapid Determination of a Complete Genome Sequence
Since the introduction of the Sanger dideoxy method in the mid-1970s, significant advances have been made in DNA-sequencing technologies, enabling the readout of progressively longer sequences with higher fidelity and shorter run times. The development of next-generation sequencing (NGS) platforms has extended this capability to formerly unforeseen levels. By combining technological breakthroughs in the handling of very small amounts of liquid, high-resolution optics, and computing power, these methods have already made a significant impact on the ability to obtain whole genome sequences rapidly and cheaply.
Next-generation sequencing refers to a family of technologies, each of which utilizes a unique approach for the determination of a DNA sequence. All of these methods are highly parallel: from 1 million to 1 billion DNA fragment sequences are acquired in a single experiment. How are NGS methods capable of attaining such a high number of parallel runs? Individual DNA fragments are amplified by polymerase chain reaction (PCR) on a solid support, such as a single bead or a small region of a glass slide, such that clusters of identical DNA fragments are distinguishable by high-resolution imaging. These fragments then serve as templates for DNA polymerase, where the addition of nucleotide triphosphates is converted to a signal that can be detected in a highly sensitive manner. The technique used to detect individual base incorporation varies among NGS methods. However, most of these can be understood simply by considering the overall reaction of chain elongation catalyzed by DNA polymerase (Figure 41.13). In the reversible terminator method, the four nucleotides are added to the template DNA, with each base tagged with a unique fluorescent label and a reversibly blocked 3′ end. The blocked end assures that only one phosphodiester linkage will form. Once the nucleotide is incorporated into the growing strand, it is identified by its fluorescent tag, the blocking agent is removed and the process is repeated.
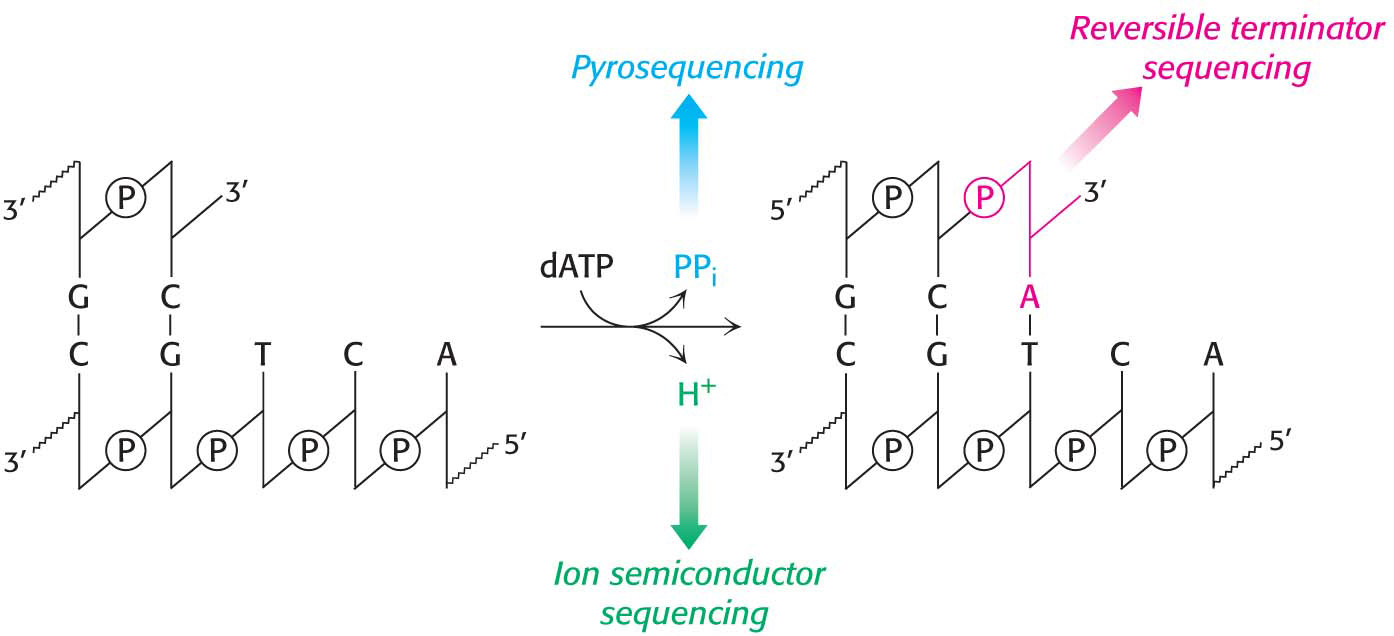
Figure 41.13: Detection methods in next-generation sequencing. Measurement of base incorporation in next-generation sequencing methods relies on the detection of the various products of the DNA polymerase reaction. Reversible terminator sequencing measures the nucleotide incorporation in a manner similar to Sanger sequencing, while pyrosequencing and ion semiconductor sequencing detect the release of pyrophosphate and protons, respectively.
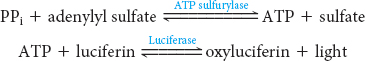
In pyrosequencing, nucleotides are added to the template DNA, one at a time in a defined order. One of the nucleotides will be incorporated into the growing strand, releasing a pyrophosphate that is detected by coupling the formation of pyrophosphate with the production of light by the sequential action of the enzymes ATP sulfurylase and luciferase:
The protocol for ion semiconductor sequencing is similar to pyrosequencing except that nucleotide incorporation is detected by sensitively measuring the very small changes in pH of the reaction mixture due to the release of proton upon nucleotide incorporation.
Regardless of the sequencing method, the technology exists to quantify the signal produced by millions of DNA fragment templates simultaneously. However, for many approaches, as few as 50 bases are read per fragment. Hence, significant computing power is required to both store the massive amounts of sequence data and perform the necessary alignments required to assemble a complete sequence. Next-generation sequencing methods are being used to answer an ever-growing number of questions in genomics, transcriptomics, and evolutionary biology, to name a few. Additionally, individual genome sequences will provide information about genetic variation within populations and may usher in an era of personalized medicine, when these data can be used to guide treatment decisions.
Selected DNA Sequences Can Be Greatly Amplified by the Polymerase Chain Reaction
Let us summarize our research accomplishments thus far. We have purified the estrogen receptor by using the monoclonal antibody that we generated (Chapter 5). We have synthesized a DNA probe that allowed us to isolate the cDNA of the receptor as well as the gene for the receptor. Finally, we have deduced the DNA sequence of the gene. Although there are many possible experiments to perform on the basis of what we have accomplished so far, let us start a new research project that will introduce us to one of the most powerful techniques in experimental biochemistry. Our experimental system thus far has been with the rat uterus. We can ask whether the receptor gene is transcribed in other tissues, such as the brain and the liver.
We could, in fact, screen cDNA libraries from these tissues, searching for a clone that contains the receptor cDNA as heretofore described. However, we will use a much more rapid means of detection. We will study cDNA prepared from brain and liver tissues as well as other tissues and will determine, with the use of the polymerase chain reaction (PCR), whether cDNA (and, by implication, the mRNA) for the receptor is present.
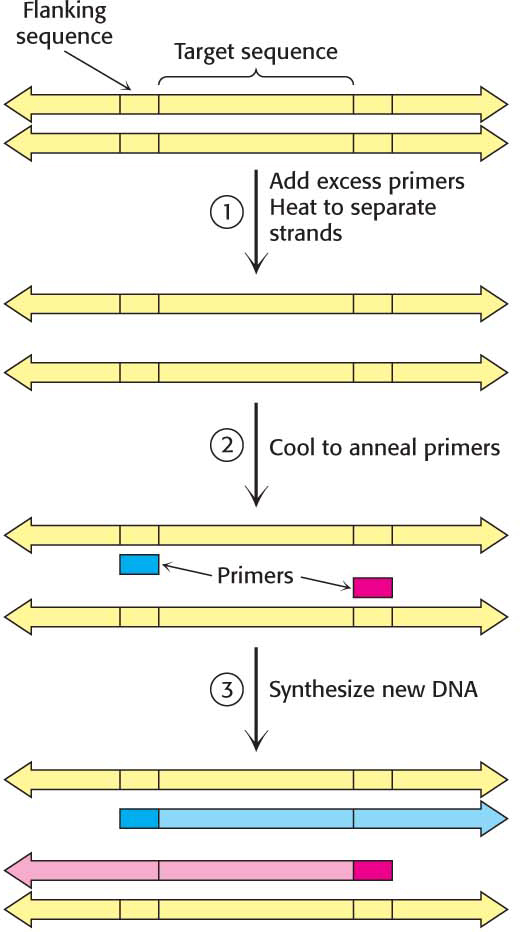
Figure 41.14: The first cycle in the polymerase chain reaction (PCR). A cycle consists of three steps: strand separation, the hybridization of primers, and the extension of primers by DNA synthesis.
Consider a DNA duplex consisting of a target sequence surrounded by nontarget DNA. In our example, the target would be the putative receptor cDNA in the brain, the liver, or muscle. If the target DNA is present, we can detect it if we first amplify the amount of DNA present. Millions of copies of the target sequences can be readily obtained by PCR if the flanking sequences of the target are known, and we know what the flanking sequences are because we have the DNA sequence of the receptor. PCR is carried out by adding the following components to a solution containing the target sequence: (1) a pair of primers that hybridize with the flanking sequences of the target, (2) all four deoxyribonucleoside triphosphates (dNTPs), and (3) a heat-stable DNA polymerase. A PCR cycle consists of three steps (Figure 41.14):
Strand Separation. The two strands of the parent DNA molecule are separated by heating the solution to 95°C for 15 s.
Hybridization of Primers. The solution is then abruptly cooled to 54°C to allow each primer to hybridize to a DNA strand. One primer hybridizes to the 3′ end of the target on one strand, and the other primer hybridizes to the 3′ end on the complementary target strand. Parent DNA duplexes do not form, because the primers are present in large excess. Primers are typically from 20 to 30 nucleotides long.
DNA Synthesis. The solution is then heated to 72°C, the optimal temperature for Taq DNA polymerase. This heat-stable polymerase comes from Thermus aquaticus, a thermophilic bacterium that lives in hot springs. The polymerase elongates both primers in the direction of the target sequence because DNA synthesis is in the 5′-to-3′ direction. DNA synthesis takes place on both strands but extends beyond the target sequence.
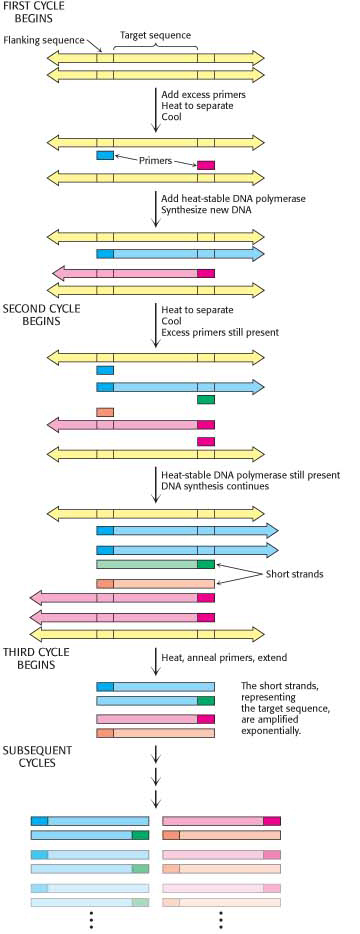
Figure 41.15: Multiple cycles of the polymerase chain reaction. The two short strands produced at the end of the third cycle (along with longer strands not shown) represent the target sequence. Subsequent cycles will amplify the target sequence exponentially and the parent sequence arithmetically.
These three steps—strand separation, the hybridization of primers, and DNA synthesis—constitute one cycle of PCR amplification and can be carried out repetitively just by changing the temperature of the reaction mixture. The thermostability of the polymerase makes it feasible to carry out PCR in a closed container; no reagents are added after the first cycle. The duplexes are heated to begin the second cycle, which produces four duplexes, and then the third cycle is initiated (Figure 41.15). At the end of the third cycle, two short strands appear that constitute only the target sequence—the sequence including and bounded by the primers. Subsequent cycles will amplify the target sequence exponentially. The larger strands increase in number arithmetically and serve as a source for the synthesis of more short strands. Ideally, after n cycles, the desired sequence is amplified 2n-fold. The amplification is a millionfold after 20 cycles and a billionfold after 30 cycles, which can be carried out in less than an hour.
Several features of this remarkable method for amplifying DNA are noteworthy. First, the sequence of the target need not be known. All that is required is knowledge of the flanking sequences. Second, the target can be much larger than the primers. Targets larger than 10 kb have been amplified by PCR. Third, primers do not have to be perfectly matched to flanking sequences to amplify targets. With the use of primers derived from a gene of known sequence, it is possible to search for variations on the theme. In this way, families of genes are being discovered with the use of PCR. Fourth, PCR is highly specific because of the stringency of hybridization at relatively high temperature. Stringency is the required closeness of the match between primer and target, which can be controlled by temperature and salt. At high temperatures, the only DNA that is amplified is that situated between primers. A gene constituting less than a millionth of the total DNA of a higher organism is accessible by PCR. Fifth, PCR is exquisitely sensitive. A single DNA molecule can be amplified and subsequently visualized in gel electrophoresis. Indeed, the amplified DNA can be isolated from the gel and inserted into a vector and cloned if so desired.
PCR examination for the presence of the estrogen receptor in cDNA libraries from various tissues reveals that significant amounts of receptor mRNA are present in pituitary, bone, liver, and muscle cells, as well as in the reproductive tissues, including ovary, mammary gland, and uterus. Further studies using the same techniques show that the estrogen receptor is found in all vertebrates.
!clinic!!bio! CLINICAL AND BIOLOGICAL INSIGHT: PCR Is a Powerful Technique in Medical Diagnostics, Forensics, and Studies of Molecular Evolution
PCR can provide valuable diagnostic information in medicine. Bacteria and viruses can be readily detected with the use of specific primers. For example, PCR can reveal the presence of human immunodeficiency virus in people who have not mounted an immune response to this pathogen and would therefore be missed with an antibody assay. Finding Mycobacterium tuberculosis bacilli, the cause of tuberculosis, in tissue specimens is slow and laborious. With PCR, as few as 10 tubercle bacilli per million human cells can be readily detected. PCR is a promising method for the early detection of certain cancers. This technique can identify mutations of certain growth-control genes, such as the ras genes. The capacity to greatly amplify selected regions of DNA can also be highly informative in monitoring cancer chemotherapy. Tests using PCR can detect when cancerous cells have been eliminated and treatment can be stopped; they can also detect a relapse and the need to immediately resume treatment. PCR is ideal for detecting leukemias caused by chromosomal rearrangements.
PCR is also having an effect in forensics and legal medicine. An individual DNA profile is highly distinctive because many genetic loci are highly variable within a population. For example, variations at specific loci determine a person’s HLA type (human-leukocyte-antigen type); organ transplants are rejected when the HLA types of the donor and recipient are not sufficiently matched. PCR amplification of multiple genes is being used to establish biological parentage in disputed paternity and immigration cases. Analyses of blood stains and semen samples by PCR have implicated guilt or innocence in numerous assault and rape cases. The root of a single shed hair found at a crime scene contains enough DNA for typing by PCR (Figure 41.16).
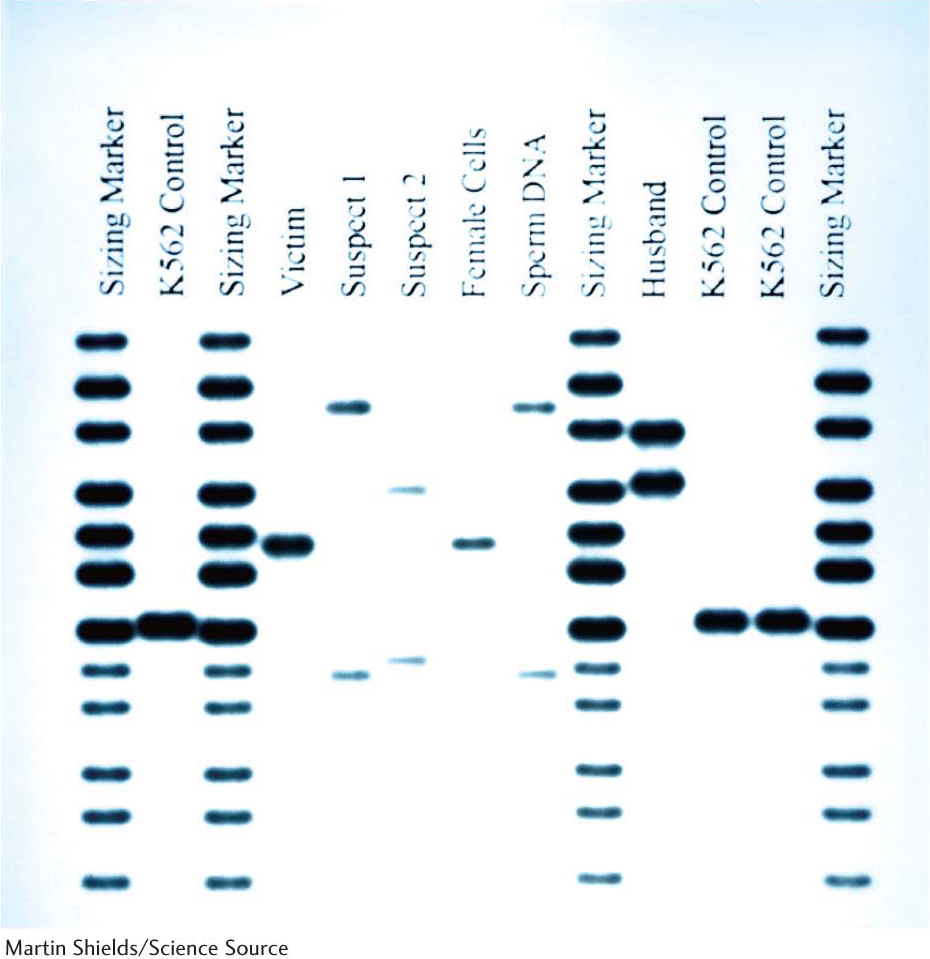
Figure 41.16: DNA and forensics. DNA isolated from sperm obtained during the examination of a rape victim was amplified by PCR, then compared with DNA from the victim and three potential suspects—the victim’s husband and two additional individuals—using gel electrophoresis and autoradiography. Sperm DNA matched the pattern of Suspect 1, but not that of Suspect 2 or the victim’s husband. Sizing marker and K562 lanes refer to control DNA samples.
Gene-Expression Levels Can Be Comprehensively Examined
Let us look now at a final technique, one that enables us to see how environmental signals, such as the presence of hormones, or pathological conditions, such as cancer, alter the expression of an array of genes in a tissue. Most genes are present in the same quantity in every cell—namely, one copy per haploid cell or two copies per diploid cell. However, the level at which a gene is expressed, as indicated by mRNA quantities, can vary widely, ranging from no expression to hundreds of mRNA copies per cell. Gene-expression patterns vary from cell type to cell type, distinguishing, for example, a muscle cell from a nerve cell. Even within the same cell, gene-expression levels can vary as the cell responds to changes in physiological circumstances. Note that mRNA levels sometimes correlate with the levels of proteins expressed, but this correlation does not always hold. Thus, care must be exercised when interpreting the results of mRNA levels alone.
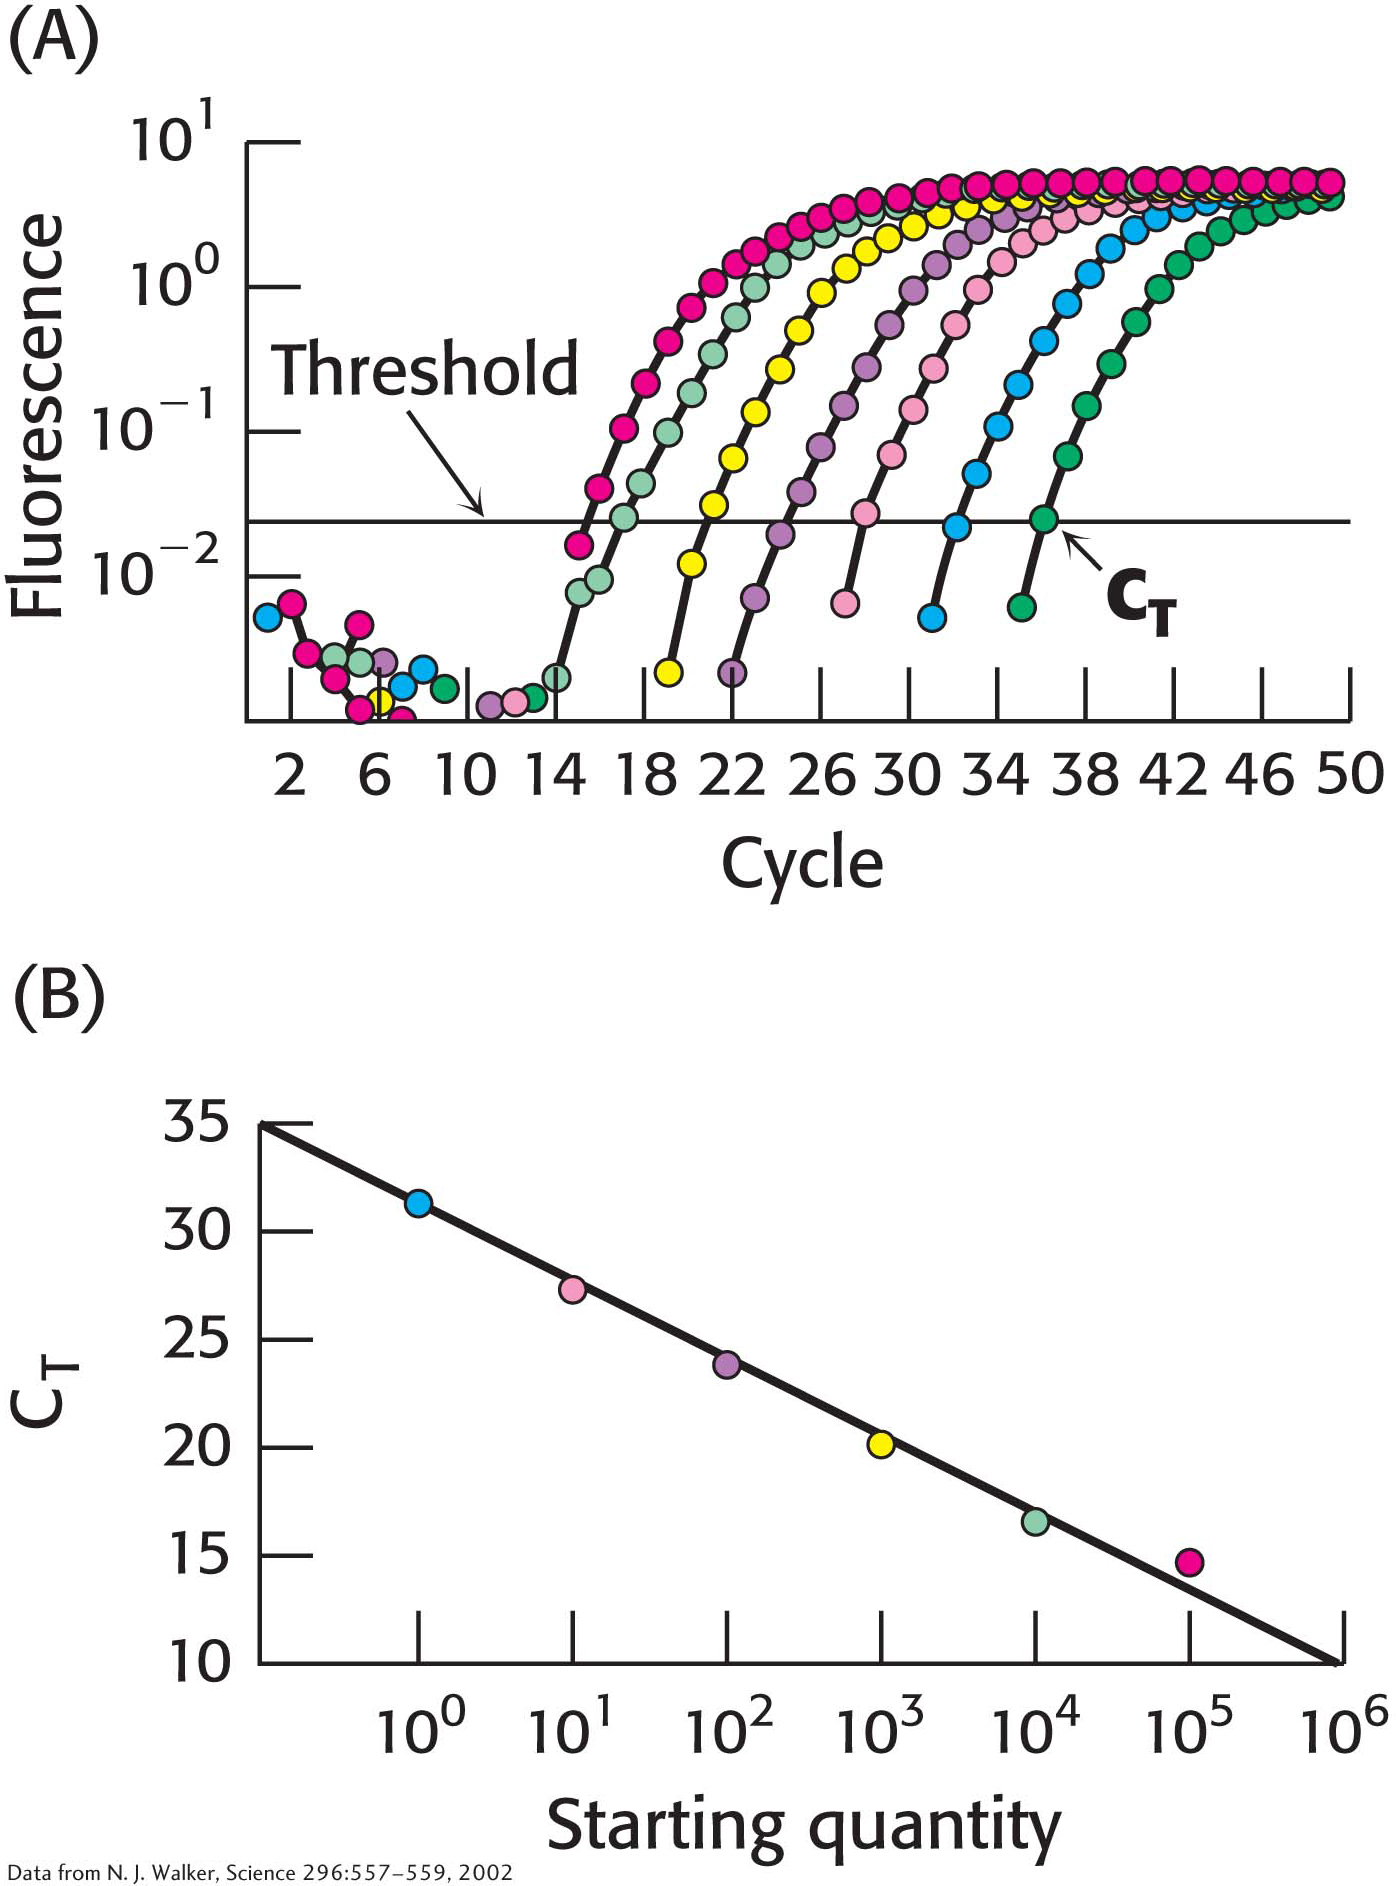
Figure 41.17: Quantitative PCR. (A) In qPCR, fluorescence is monitored in the course of PCR amplification to determine CT, the cycle at which this signal exceeds a defined threshold. Each color represents a different starting quantity of DNA. (B) CT values are inversely proportional to the number of copies of the original cDNA template.
The quantity of individual mRNA transcripts can be determined by quantitative PCR (qPCR), or real-time PCR. RNA is first isolated from the cell or tissue of interest. With the use of reverse transcriptase, cDNA is prepared from this RNA sample. In one qPCR approach, the transcript of interest is PCR amplified with the appropriate primers in the presence of the dye SYBR Green I, which fluoresces brightly when bound to double-stranded DNA. In the initial PCR cycles, not enough duplex is present to allow a detectable fluorescence signal. However, after repeated PCR cycles, the fluorescence intensity exceeds the detection threshold and continues to rise as the number of duplexes corresponding to the transcript of interest increases (Figure 41.17). Importantly, the cycle number at which the fluorescence becomes detectable over a defined threshold (or CT) is indirectly proportional to the number of copies of the original template. After the relation between the original copy number and the CT has been established with the use of a known standard, subsequent qPCR experiments can be used to determine the number of copies of any desired transcript in the original sample, provided the appropriate primers are available.
Although qPCR is a powerful technique for quantitation of a small number of transcripts in any given experiment, we can now use our knowledge of complete genome sequences to investigate an entire transcriptome, the pattern and level of expression of all genes in a particular cell or tissue. One of the most powerful methods developed to date for this purpose is based on hybridization. Oligonucleotides or cDNAs are affixed to a solid support such as a microscope slide, creating a DNA microarray, or gene chip. Fluorescently labeled cDNA is then hybridized to the chip to reveal the expression level for each gene, identifiable by its known location on the chip. The intensity of the fluorescent spot on the chip reveals the extent of the transcription of a particular gene. Figure 41.18 shows the pattern of genes that are induced or repressed in various breast-cancer tumors, and Figure 41.19 shows how yeast transcription varies under different conditions. An analysis of mRNA pools with the use of these chips revealed, for example, that approximately 50% of all yeast genes are expressed at steady-state levels of 0.1 to 1.0 mRNA copy per cell. This method readily detected variations in expression levels displayed by specific genes under different growth conditions.
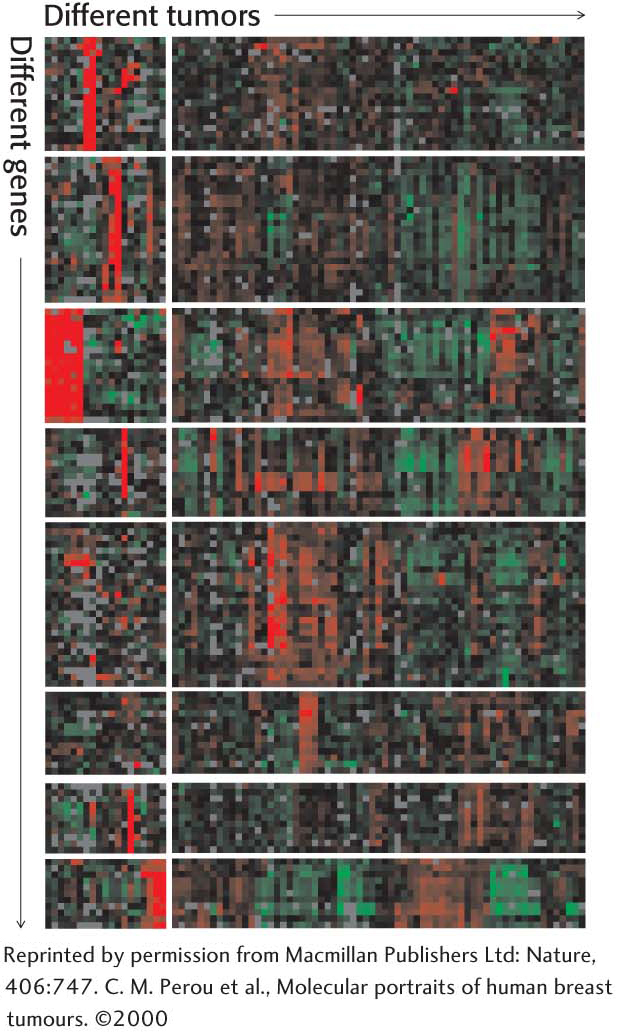
Figure 41.18: Gene-expression analysis with microarrays. The expression levels of thousands of genes can be simultaneously analyzed by using DNA microarrays (gene chips). Here, the analysis of 1733 genes in 84 breast-tumor samples reveals that the tumors can be assorted into distinct classes on the basis of their gene-expression patterns. Red corresponds to gene induction, and green corresponds to gene repression.
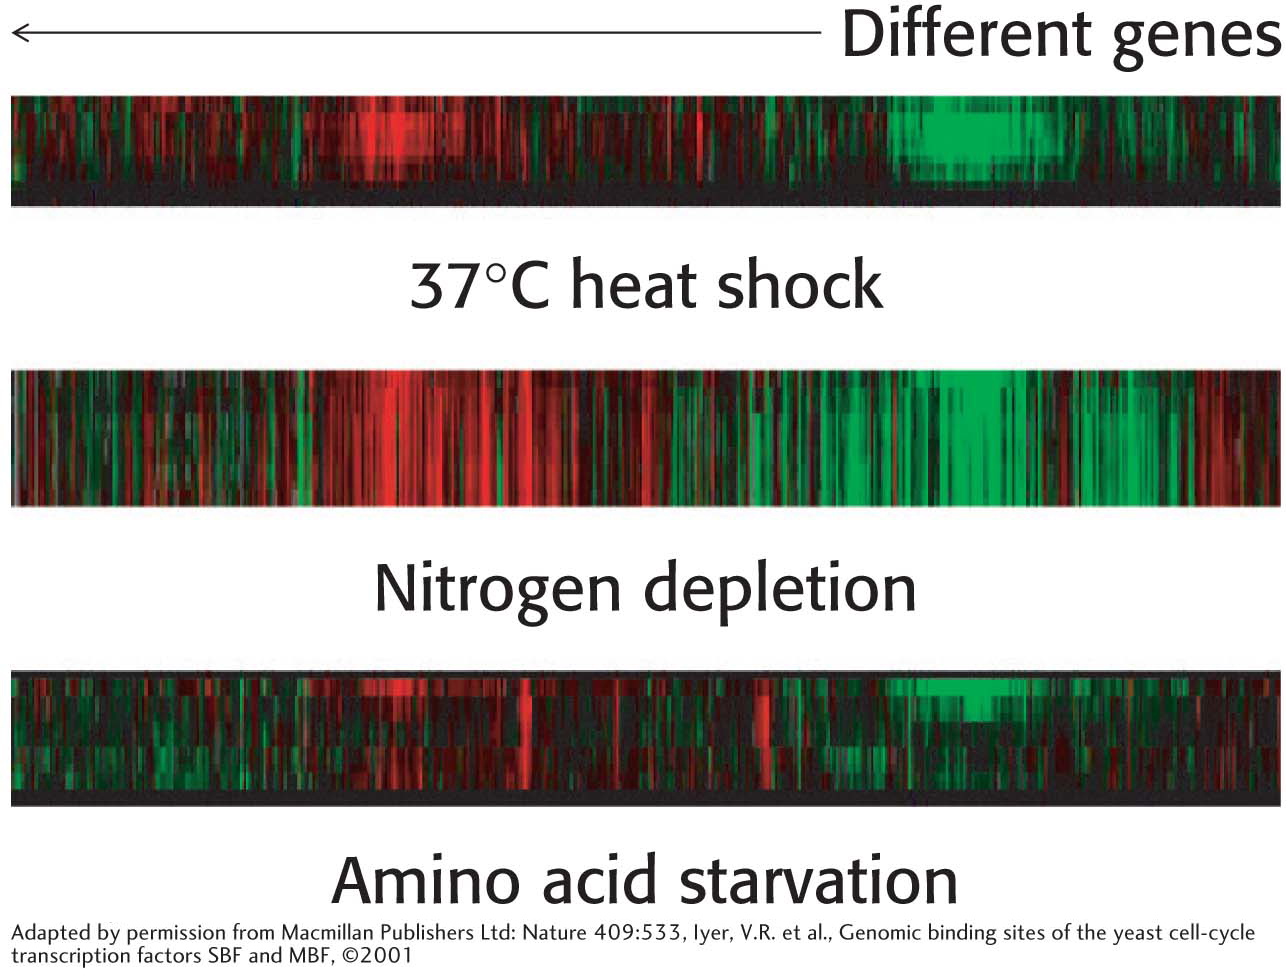
Figure 41.19: Monitoring changes in gene expression in yeast. This microarray analysis shows levels of gene expression for yeast genes under different conditions.