7.2 The Michaelis–Menten Model Describes the Kinetics of Many Enzymes
✓ 4 Explain how reaction velocity is determined and how reaction velocities are used to characterize enzyme activity.
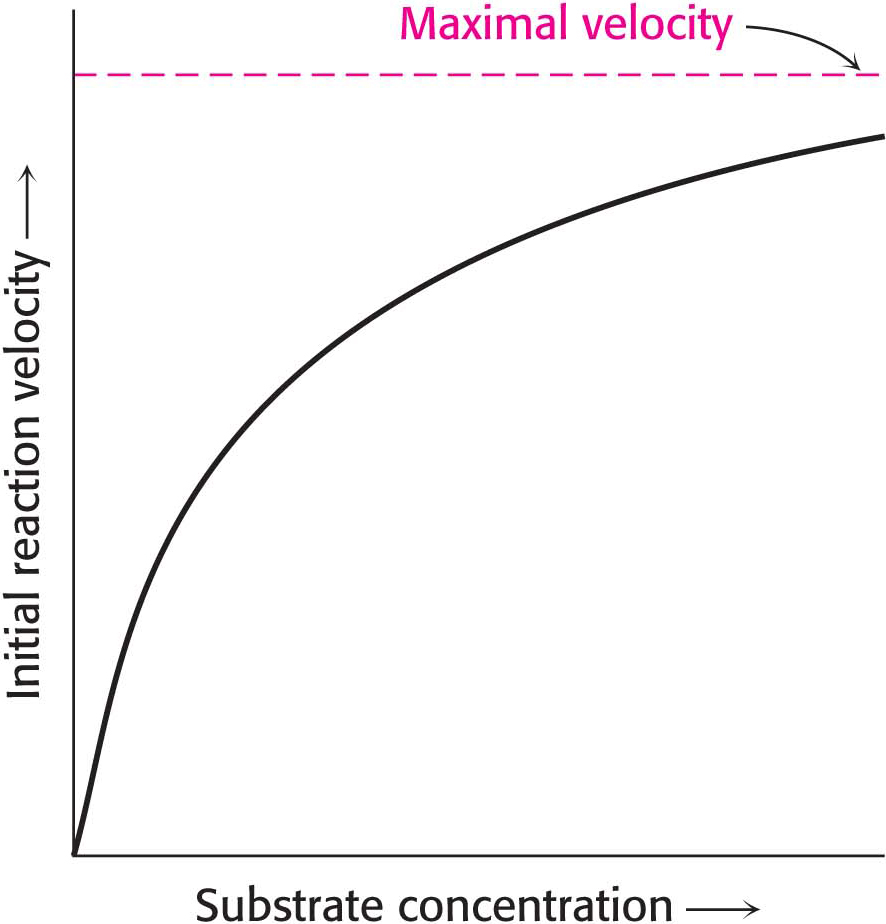
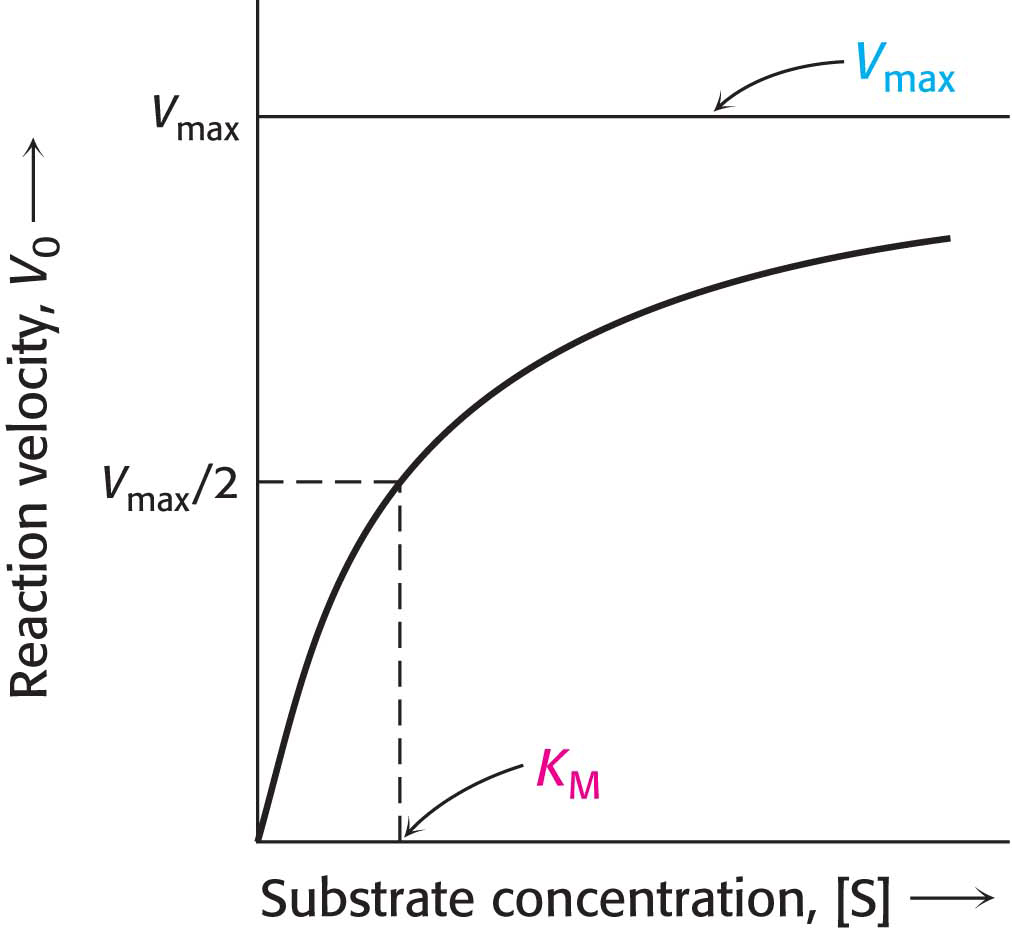
The initial velocity of catalysis, which is defined as the number of moles of product formed per second shortly after the reaction has begun, varies with the substrate concentration [S] when enzyme concentration is constant, in the manner shown in Figure 7.1. Examining how velocity changes in response to changes in substrate concentration is a reasonable way to study enzyme activity because variation in substrate concentration depends on environmental circumstances (for instance, after a meal), but enzyme concentration is relatively constant, especially on the time scale of reaction rates.
Before we can fully interpret this graph, we need to examine some of the parameters of the reaction. Consider an enzyme E that catalyzes the conversion of S into P by the following reaction:
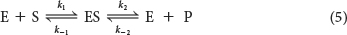
where k1 is the rate constant for the formation of the enzyme–
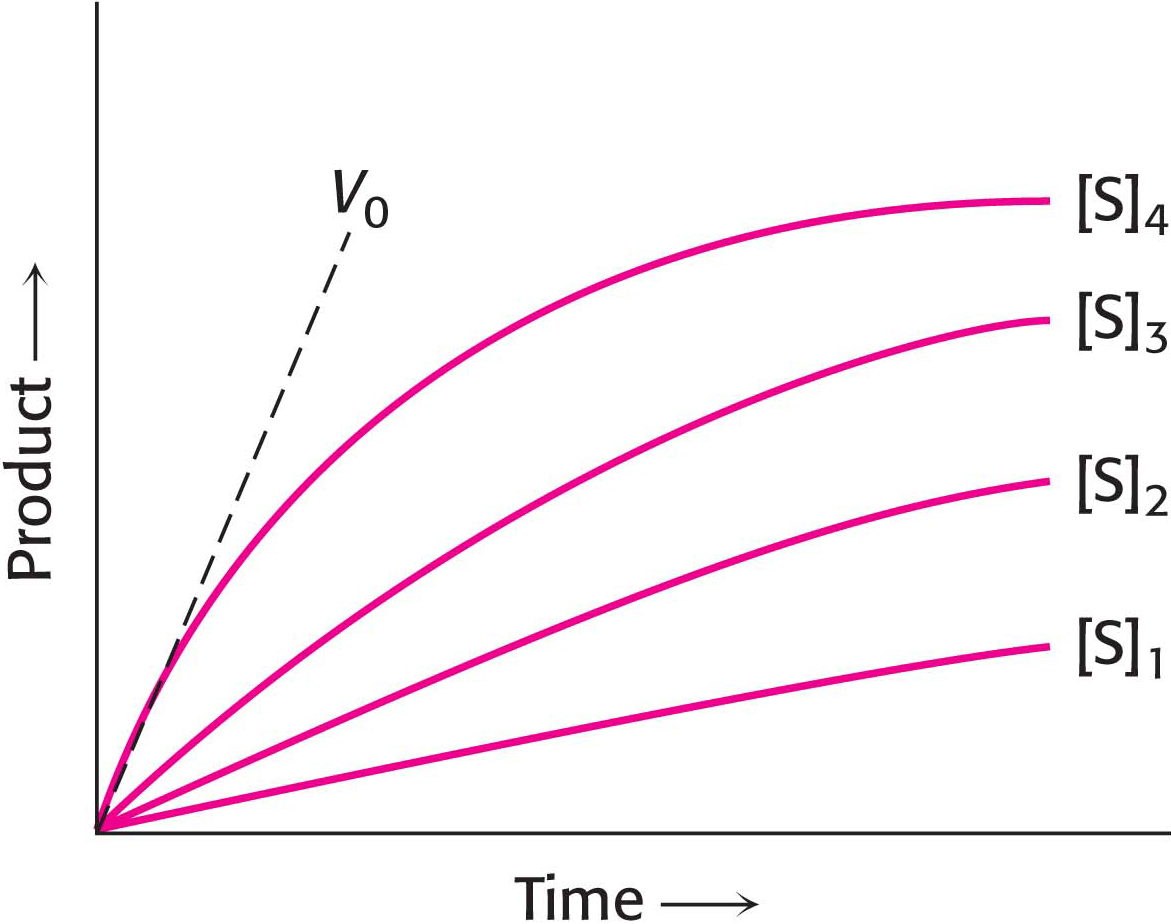
We can simplify the entire discussion of enzyme kinetics if we ignore the reverse reaction of product forming substrate. We can define the rate of catalysis V0, or the initial rate of catalysis, as the number of moles of product formed per second when the reaction is just beginning—
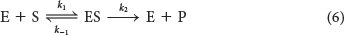
Enzyme E combines with substrate S to form an ES complex, with a rate constant k1. The ES complex has two possible fates. It can dissociate to E and S, with a rate constant k−1, or it can proceed to form product P, with a rate constant k2.
In 1913, on the basis of this reaction scheme and with some simple assumptions, Leonor Michaelis and Maud Menten proposed a simple model to account for these kinetic characteristics. The critical feature in their treatment is that a specific ES complex is a necessary intermediate in catalysis. The notion that an enzyme needed to bind substrate before catalysis could take place was not evident to the early biochemists. Some believed that enzymes might release emanations that converted substrate into product.
The Michaelis–
114
where
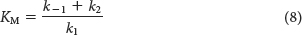
KM, a compilation of rate constants called the Michaelis constant, is unique to each enzyme and is independent of enzyme concentration. KM describes the properties of the enzyme–

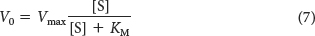
Vmax is directly dependent on enzyme concentration. Equation 7 describes the typical Michaelis–
!quickquiz! QUICK QUIZ 1
What value of [S], as a fraction of KM, is required to obtain 80% Vmax?
Consider the circumstances when V0 = Vmax/2. Under these conditions, the practical meaning of KM is evident from equation 7. Using V0 = Vmax/2, and solving for [S], we see that [S] = KM at V0 = Vmax/2. Thus, KM is equal to the substrate concentration at which the reaction velocity is half its maximal value. KM is an important characteristic of an enzyme-
Variations in KM Can have Physiological Consequences
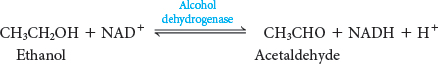
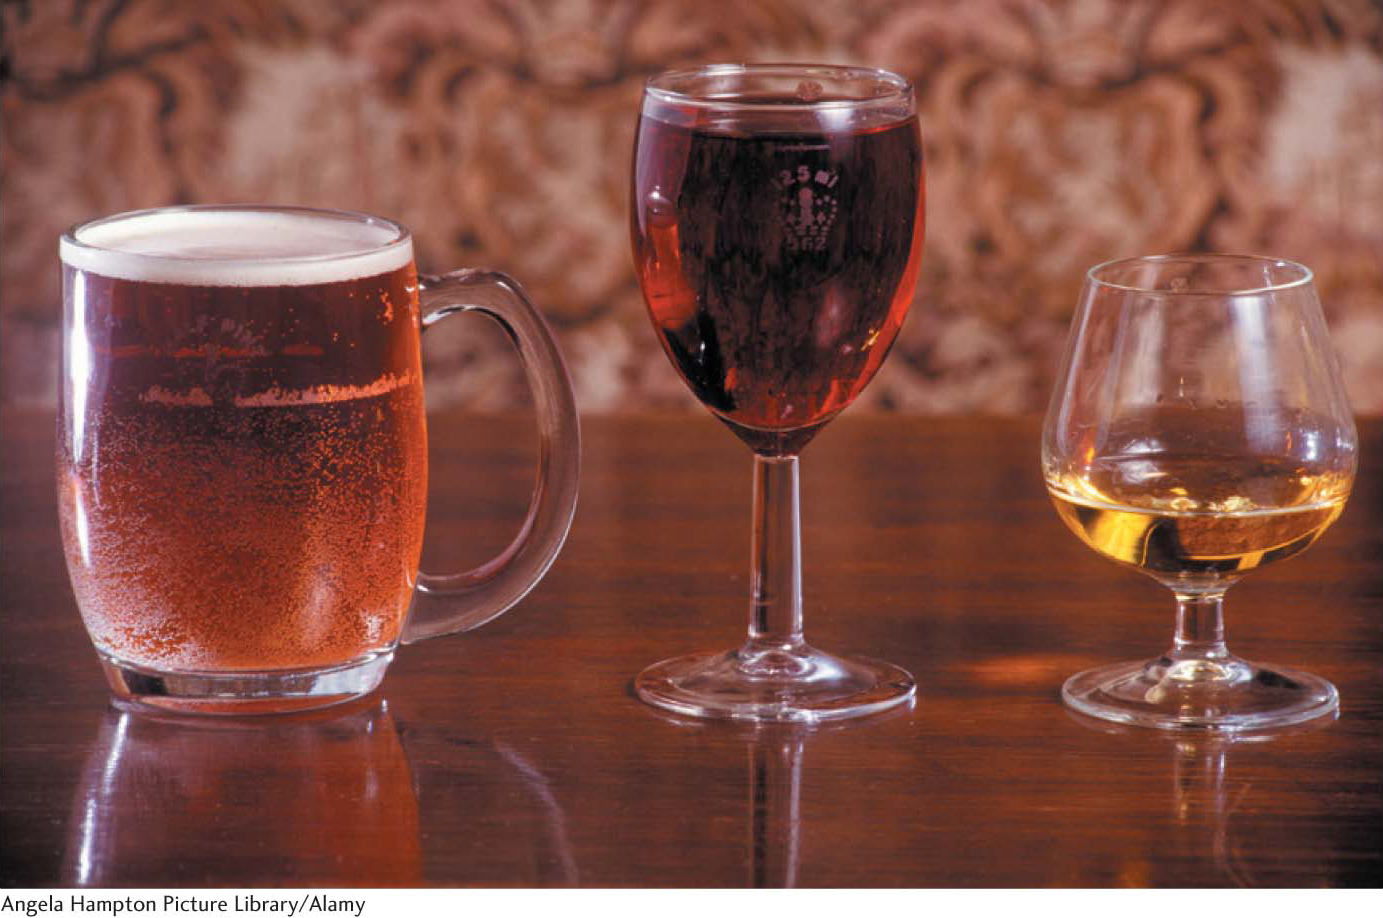
The physiological consequence of KM is illustrated by the sensitivity of some persons to ethanol (Figure 7.4). Such persons exhibit facial flushing and rapid heart rate (tachycardia) after ingesting even small amounts of alcohol. In the liver, alcohol dehydrogenase converts ethanol into acetaldehyde:
Normally, the acetaldehyde, which is the cause of the symptoms when present at high concentrations, is processed to acetate by aldehyde dehydrogenase:

Most people have two forms of the aldehyde dehydrogenase, a low KM mitochondrial form and a high KM cytoplasmic form. In susceptible persons, the mitochondrial enzyme is less active owing to the substitution of a single amino acid, and so acetaldehyde is processed only by the cytoplasmic enzyme. Because the cytoplasmic enzyme has a high KM, it achieves a high rate of catalysis only at very high concentrations of acetaldehyde. Consequently, less acetaldehyde is converted into acetate; excess acetaldehyde escapes into the blood and accounts for the physiological effects.
115
KM and Vmax Values Can Be Determined by Several Means

KM is equal to the substrate concentration that yields Vmax/2; however, Vmax, like perfection, is approached but never attained. How, then, can we experimentally determine KM and Vmax, and how do these parameters enhance our understanding of enzyme-
Before the availability of computers, the determination of KM and Vmax values required algebraic manipulation of the basic Michaelis–
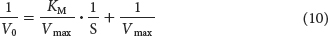
A plot of 1/V0 versus 1/[S], called a double-
KM and Vmax Values Are Important Enzyme Characteristics
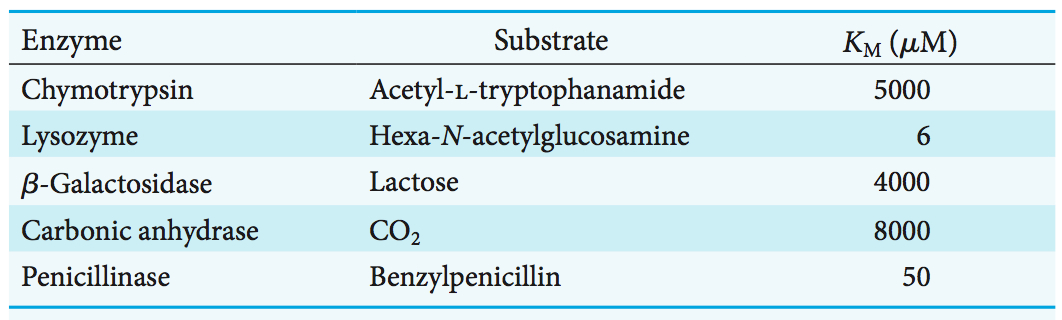
The KM values of enzymes range widely (Table 7.1). For most enzymes, KM lies between 10−1 and 10−7 M. The KM value for an enzyme depends on the particular substrate and on environmental conditions such as pH, temperature, and ionic strength. The Michaelis constant KM, as already noted, is equal to the concentration of substrate at which half the active sites are filled. Thus, KM provides a measure of the substrate concentration required for significant catalysis to take place. For many enzymes, experimental evidence suggests that the KM value provides an approximation of substrate concentration in vivo, which in turn suggests that most enzymes evolved to have significant activity at the substrate concentration commonly available. We can speculate about why an enzyme might evolve to have a KM value that corresponds to the substrate concentration normally available to the enzyme. If the normal concentration of substrate is approximately equal to KM, the enzyme will display significant activity and yet the activity will be sensitive to changes in environmental conditions—
116
The maximal velocity Vmax reveals the turnover number of an enzyme, which is the number of substrate molecules that an enzyme can convert into product per unit time when the enzyme is fully saturated with substrate. The turnover number is equal to the rate constant k2, which is also called kcat. If the total concentration of active sites, [E]T, is known, then

and thus

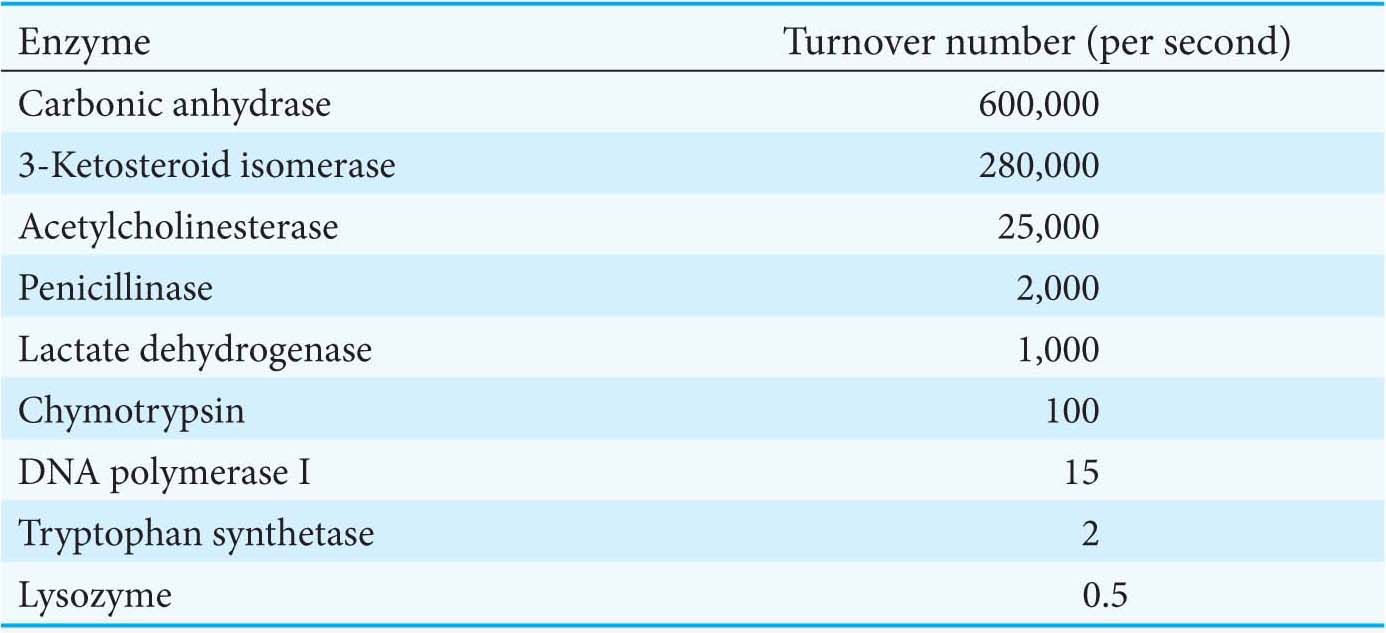
For example, a 10−6 M solution of carbonic anhydrase catalyzes the formation of 0.6 M H2CO3 per second when the enzyme is fully saturated with substrate. Hence, k2 is 6 × 10⁵ s−1. This value is one of the largest known turnover numbers. Each catalyzed reaction takes place in a time equal to, on average, 1/k2, which is 1.7 μs for carbonic anhydrase. The turnover numbers of most enzymes with their physiological substrates fall in the range from 1 to 104 per second (Table 7.2).
kcat/KM Is a Measure of Catalytic Efficiency
When the substrate concentration is much greater than KM, the velocity of catalysis approaches Vmax. However, in the cell, most enzymes are not normally saturated with substrate. Under physiological conditions, the amount of substrate present is often between 10% and 50% KM. Thus, the [S]/KM ratio is typically between 0.01 and 1.0. When [S] ≪ KM, the enzymatic rate is much less than kcat (k2) because most of the active sites are unoccupied. We can derive an equation that characterizes the kinetics of an enzyme under these cellular conditions:
When [S] ≪ KM, almost all active sites are empty. In other words, the concentration of free enzyme, [E], is nearly equal to the total concentration of enzyme, [E]T; so
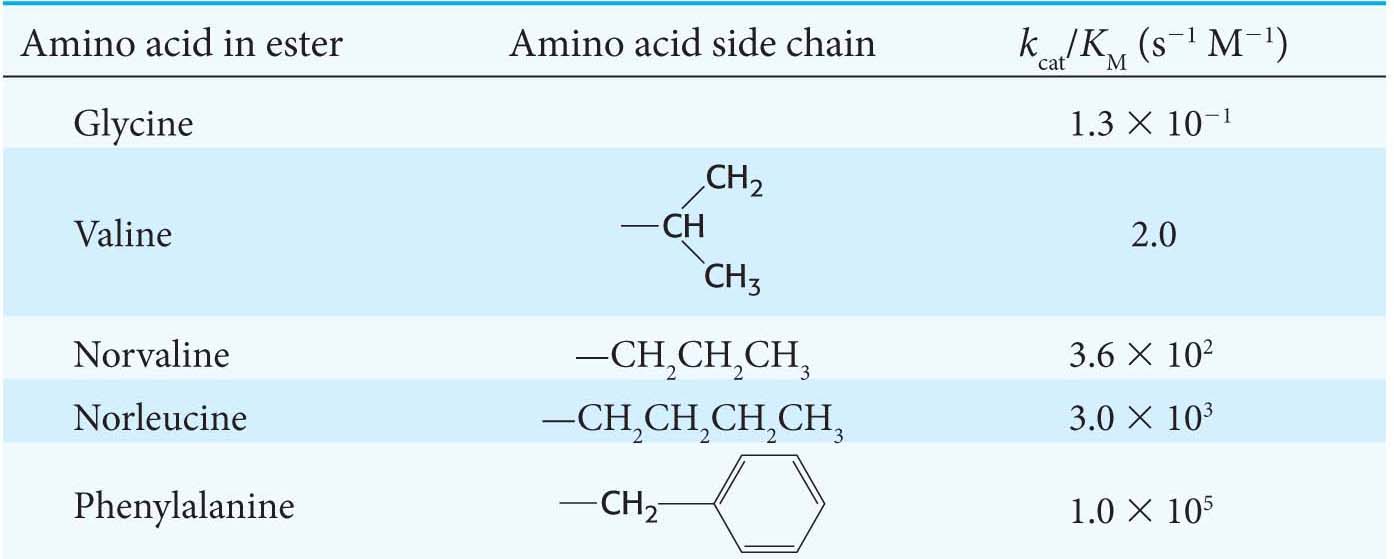
Thus, when [S] ≪ KM, the enzymatic velocity depends on the values of kcat/KM, [S], and [E]T. Under these conditions, kcat/KM is the rate constant for the interaction of S and E. The rate constant kcat/KM, called the specificity constant, is a measure of catalytic efficiency because it takes into account both the rate of catalysis with a particular substrate (kcat) and the nature of the enzyme–
117
How efficient can an enzyme be? We can approach this question by determining whether there are any physical limits on the value of kcat/KM. Note that the kcat/KM ratio depends on k1, k−1, and kcat, as can be shown by substituting for KM:

Suppose that the rate of formation of product (kcat) is much faster than the rate of dissociation of the ES complex (k–1). The value of kcat/KM then approaches k1. Thus, the ultimate limit on the value of kcat/KM is set by k1, the rate of formation of the ES complex. This rate cannot be faster than the diffusion-
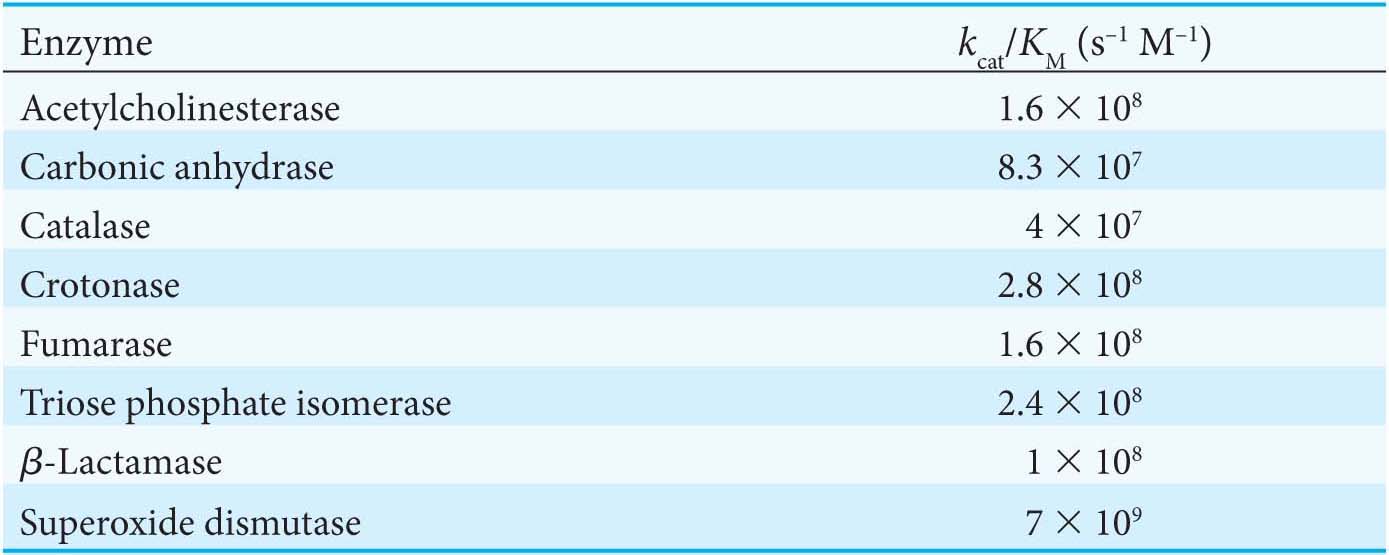
The kcat/KM ratios of the enzymes superoxide dismutase, acetylcholinesterase, and triose phosphate isomerase are between 108 and 109 s−1 M−1. Enzymes that have kcat/KM ratios at the upper limits have attained kinetic perfection. Their catalytic velocity is restricted only by the rate at which they encounter substrate in the solution (Table 7.4).
Most Biochemical Reactions Include Multiple Substrates
The simplest way to explain Michaelis–

118
Many such reactions transfer a functional group, such as a phosphoryl or an ammonium group, from one substrate to the other. Those that are oxidation–
Multiple-
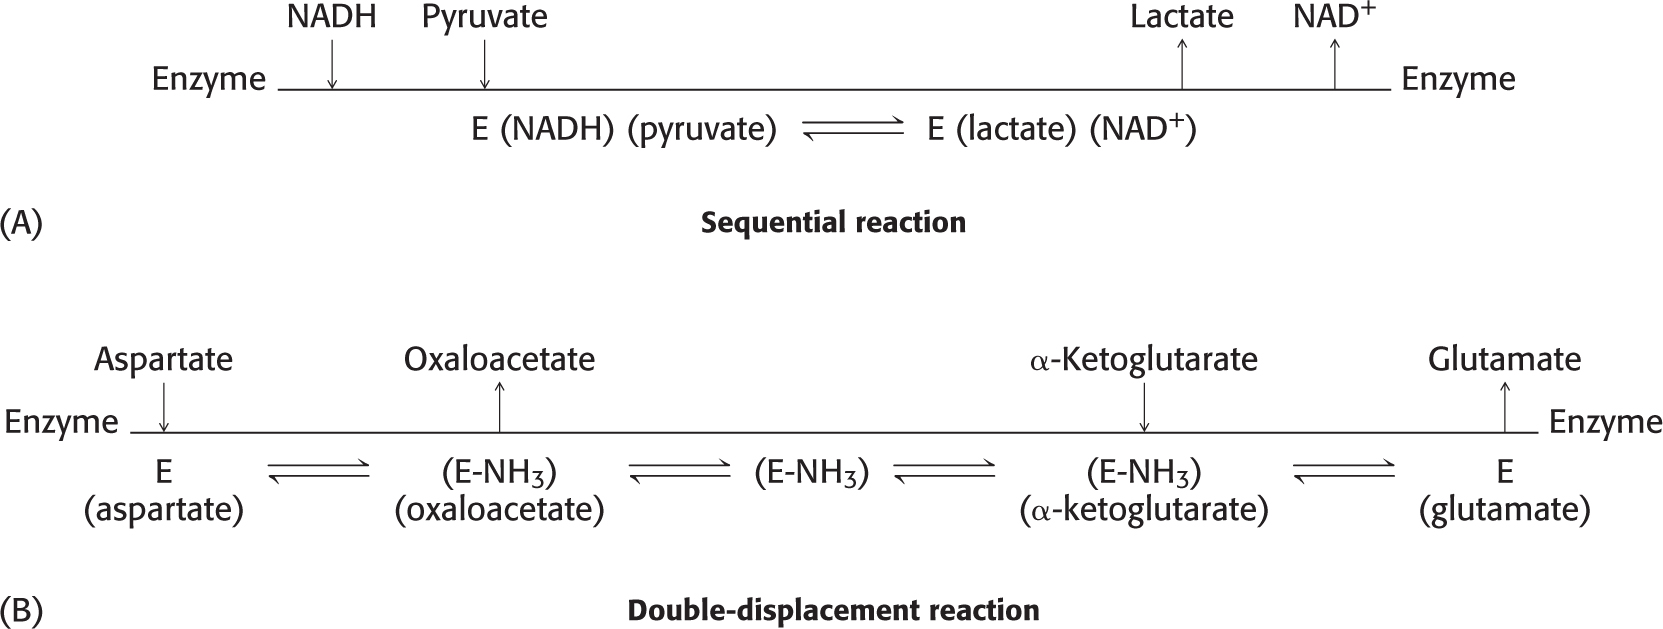
Sequential reactionsIn sequential reactions (Figure 7.6A), all substrates must bind to the enzyme before any product is released. Consequently, in a bisubstrate reaction, a ternary complex consisting of the enzyme and both substrates forms. Sequential mechanisms are of two types: ordered, in which the substrates bind the enzyme in a defined sequence, and random.
Double-displacement (ping-pong) reactionsIn double-