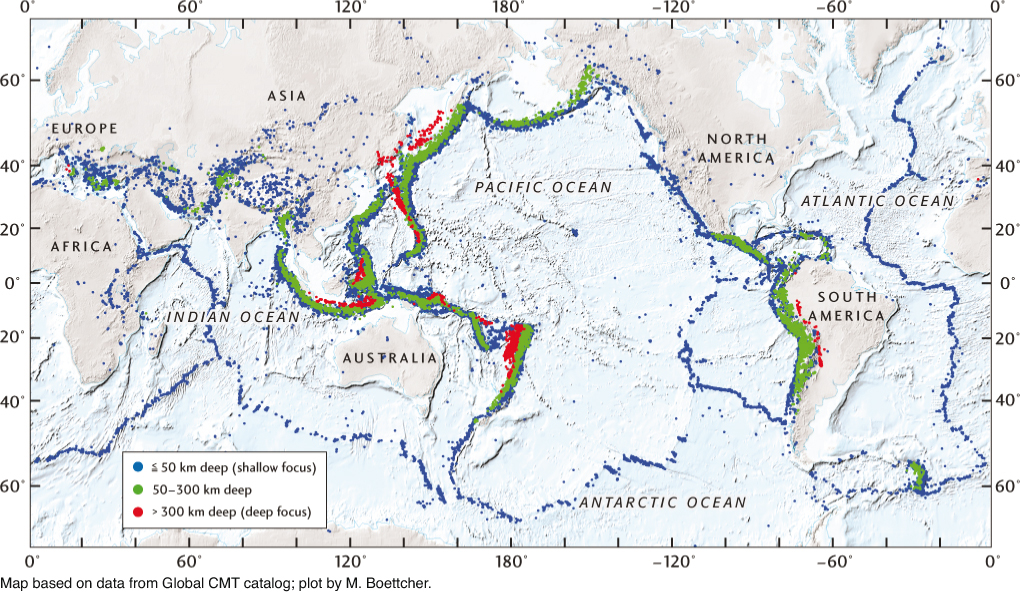
Figure 13.16Global map of seismic activity from January, 1976, through October, 2013. Each dot represents the epicenter of an earthquake larger than magnitude 5. Colors indicate the focal depth. Note the concentration of earthquakes along the boundaries between major lithospheric plates.